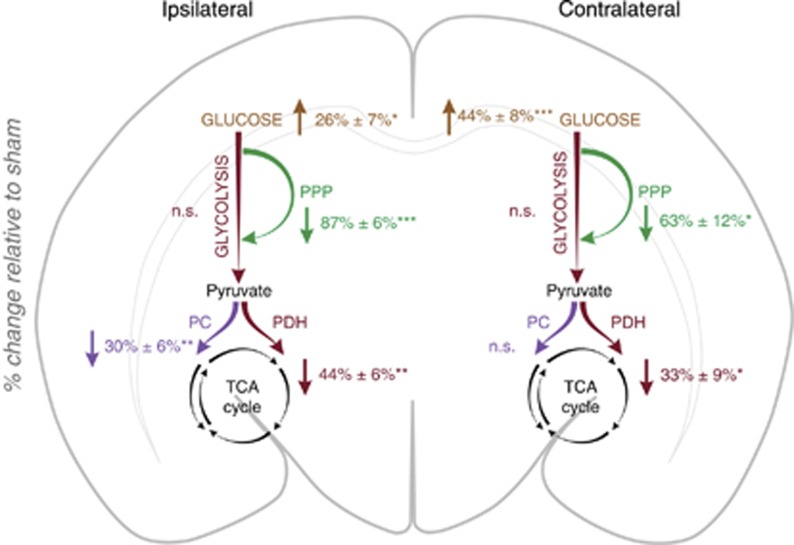
Figure 2.
The major overall metabolic changes in the ipsilateral and contralateral hemispheres of animals subjected to hypoxia-ischemia (HI) (n=9) compared with sham-operated animals (n=8) (ipsilateral versus ipsilateral and contralateral versus contralateral) based on results presented in Tables 1 and 3. Results are presented as the percent change relative to sham. The measure of variance is the s.e.m. as the percent of control. The values are based on the sum of amounts of several labeled metabolites except from the values for glucose, which are only based on changes in amounts of [1,2-13C]glucose. Glycolysis: sum of [2,3-13C]lactate and [2,3-13C]alanine. PPP: sum of [4-13C]glutamate, [4-13C]glutamine, [2-13C]GABA, [3-13C]lactate, and [3-13C]alanine. PC: sum of [2,3-13C]glutamate, [2,3-13C]glutamine, and [2,3-13C]aspartate. PDH: sum of [4,5-13C]glutamate, [4,5-13C]glutamine, [1,2-13C]GABA, [1,2-13C]aspartate, and [3,4-13C]aspartate. To test for differences, an unpaired Student's t-test was applied. *P<0.05, **P<0.01, ***P<0.001. The metabolic pathway is marked as ‘n.s.' when no significant differences were found. n.s., not significantly different from control; PC, pyruvate carboxylase; PDH, pyruvate dehydrogenase; PPP, pentose phosphate pathway.

