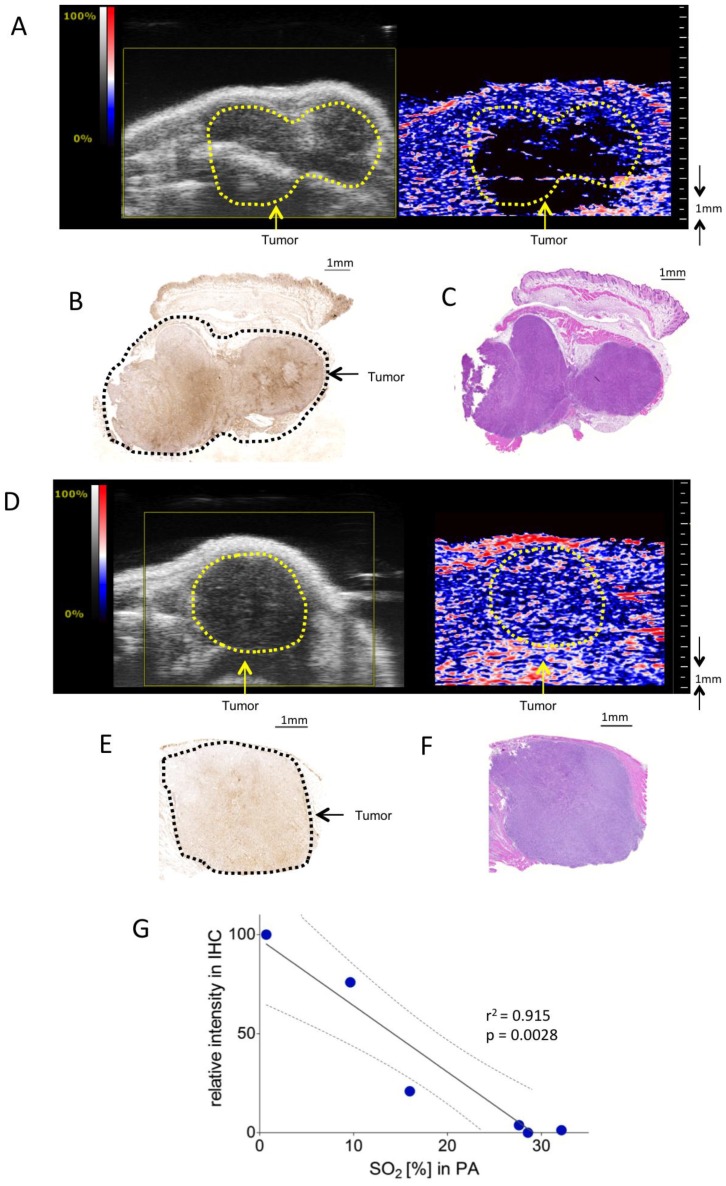
Figure 2.
Assessment of tumor hypoxia in subcutaneous pancreatic tumor xenografts. A) Representative Oxy-Hemo PA image of a hypoxic s.c. tumor. B-mode image (left panel) and oxygen saturation map (Oxy-Hemo PA imaging, right panel) are placed side-by-side showing the same imaging window. The heat map represents oxygen saturation level, ranging from 100% (red) to 0% (dark blue). Spots below the defined threshold of total Hb (20% of the maximum intensity) are black (see methods). The yellow line represents the tumor region. B) Representative hypoxia staining (brown color) of the same s.c. tumor. The black line represents the tumor region. C) Representative H&E staining of the hypoxic s.c. tumor displayed in Figure 2A. D) Representative Oxy-Hemo PA image of a non-hypoxic s.c. tumor. B-mode image and oxygen saturation map (Oxy-Hemo photoacoustic image is placed in the right panel showing the same imaging window). The heat map is as above. The yellow line represents the tumor region. E) Representative pimonidazole staining of the non-hypoxic s.c. tumor, which accordingly lacks brown staining, imaged in Figure 2D. The black line represents the tumor region. F) Representative H&E staining of the same non-hypoxic s.c. tumor. G) Graphical representation of linear regression analysis from PA-based sO2 measurements and corresponding pimonidazole staining intensities. Pimonidazole intensities were normalized with the highest value in the data set adjusted to 100 and the lowest intensity set to 0. Confidence bands for the 95%-confidence interval are shown (dotted lines).

