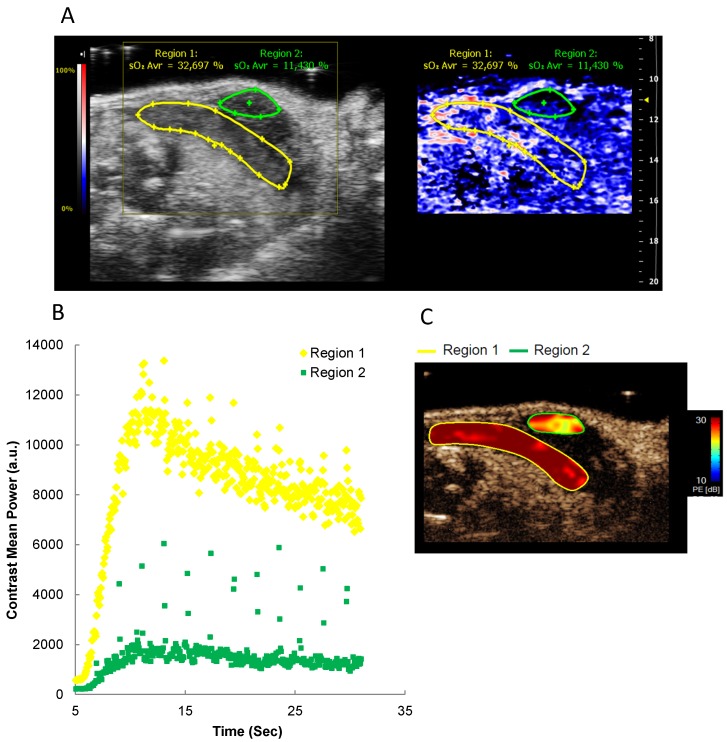
Figure 4.
Oxygen saturation and tumor perfusion kinetics in a heterogeneous orthotopic pancreatic tumor. A) Representative Oxy-Hemo PA imaging of a heterogeneous orthotopic pancreatic cancer. B-mode image and oxygen saturation map (Oxy-Hemo photoacoustic imaging) are placed side-by-side showing the same imaging window. PA-derived oxygen saturation map is displayed as in figure 2. The green and yellow lines represent different tumor regions. Average O2 saturation levels are presented above the tumor regions in green and yellow, respectively. B) Microbubble wash-in curve of different tumor regions after bolus i.v. injection of microbubbles. C) Peak enhancement quantified by Vevo CQTM. The heat map represents contrast signal peak enhancement, range from 30 (red) to 10 (blue) dB. A higher tumor perfusion is observed in region 1 compared to region 2.

