Figure 5.
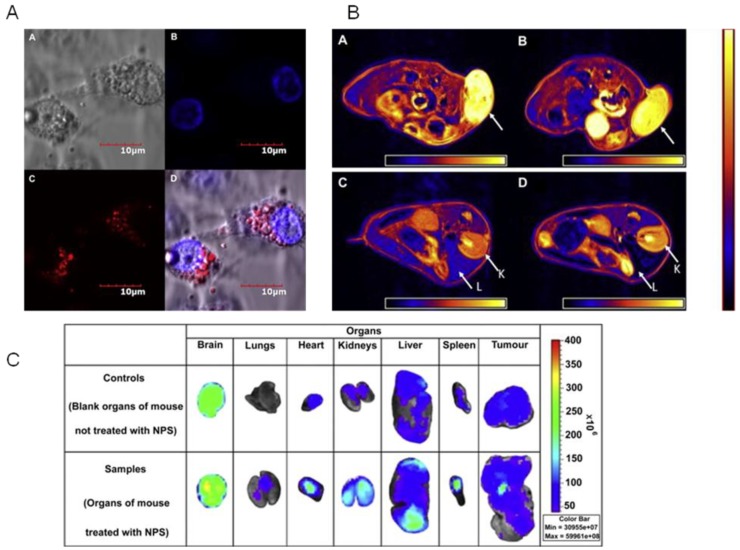
Multimodal imaging of polymeric nanoparticles A) Confocal images of MCF-7 cells treated with the quantum dots and iron oxides loaded PLA-TPGS nanoparticle in vitro (scale bar = 10 μm). A: Bright field image of cells. B: Blue coded stained nuclei. C: Red coded quantum dots from nanoparticles in cytoplasm. D: Complete overlapped image. B) Axial MRI image sections of the MCF-7 grafted tumor bearing mice. Images A and B show the part of the tumor (shown by the arrow) before and after 6 h of administration of the quantum dots and iron oxides-loaded PLA-TPGS nanoparticle into the mice. Images C and D show the kidney (K) and liver (L) part of the mice before and 6 h after the administration of the PLA-TPGS nanoparticle formulation of quantum dots and iron oxides (dosage: 1.5 mg of Cd/kg of body weight or equivalent of 6.0 mg of Fe/kg body weight). The decrease in intensity in the regions of the tumor and liver can be noticed in comparison with the color scale aside. C) Fluorescent images of the various organs. Upper row: control. Lower row: Organs of the mouse treated with the quantum dots and iron oxides-loaded PLA-TPGS nanoparticle (dosage: 1.5 mg of Cd/kg of body weight or equivalent of 6.0 mg of Fe/kg body weight). Reproduced with permission from Figure 2, 5, 6 of ref. 18 Elsevier Ltd, © (2011).

