Figure 9.
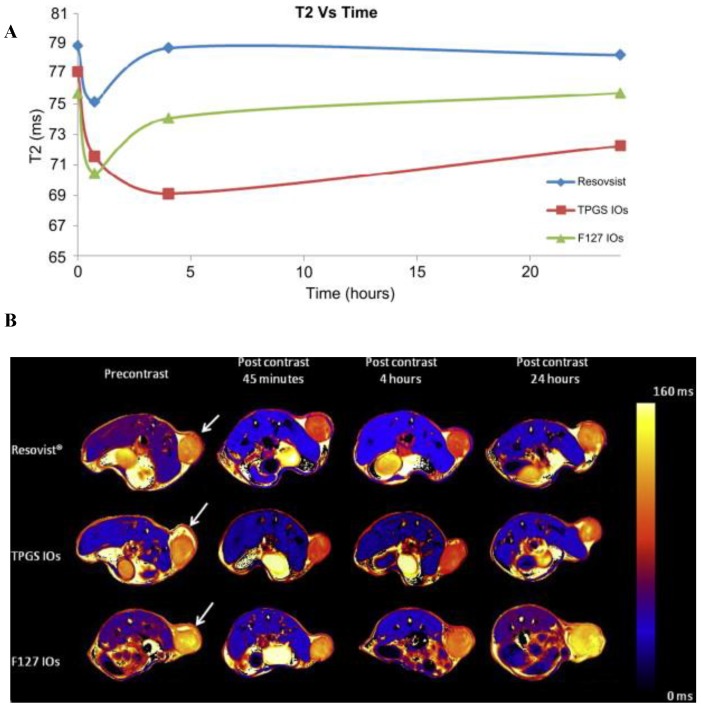
In vivo imaging of theranostic micelles loaded with iron oxide nanoparticles A) Graph showing the change of T2 values measured from MCF-7 xenograft tumor at the time point before and 45 min, 4 h and 24 h after injection of the iron oxide nanoparticles (IOs)-loaded TPGS and F127 micelle and Resovist®, respectively at a concentration of 5 mg of Fe/Kg of animal weight. It can be found that the T2 value decreases due to accumulation of IOs at tumor by ∼4.3%, 7.3% and 6.9% for Resovist®, the IOs-loaded TPGS and F127 micelles respectively at 45 min after injection. B) T2 mapped images showing the MCF-7 xenograft tumor at the designated time point before and 45 min, 4 h and 24 h after injection of Resovists®, the IOs-loaded TPGS and F127 micelles respectively at a concentration of 5 mg of Fe/Kg of animal weight. The change in T2 in the tumor (marked by the arrow) can be noticed in comparison with the T2 color scale aside. Reprinted with permission from Figure 9, 10 of ref. 108 Elsevier Ltd, © (2011).

