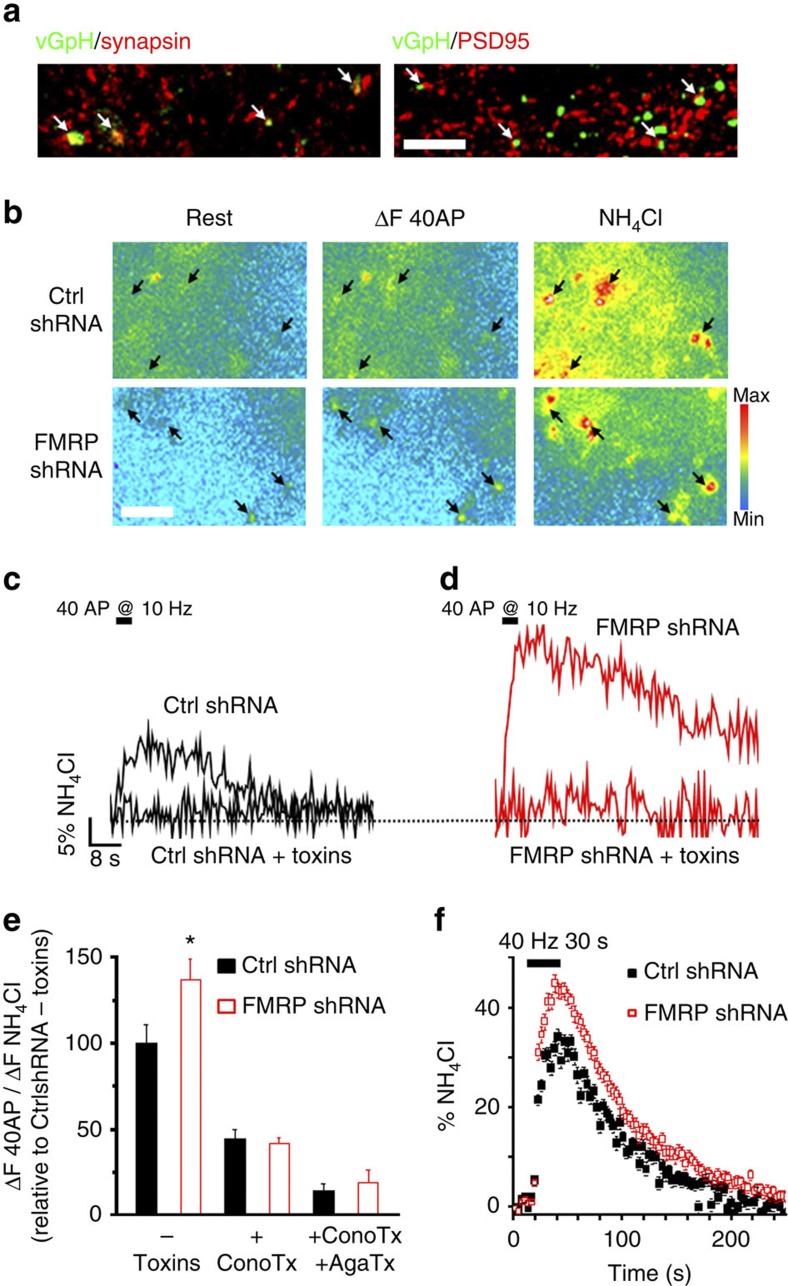
Figure 8. FMRP knockdown enhances synaptic vesicle exocytosis in presynaptic terminals of DRG neurons via CaV2.2 channels.
(a) Presynaptic terminals of DRG neurons expressing vGpH (vGpH). Images show vGpH fluorescence (green) colocalized with endogenous synapsin 1 and 2 (left panel, red) and apposed to endogenous PSD-95 (right panel, red). Synapses are indicated by the white arrows. Scale bars, 5 μm. (b) Fluorescence changes (ΔF) of vGpH in presynaptic terminals of DRG neurons transfected with Ctrl shRNA (top panels) or FMRP shRNA (bottom panels) in response to electrical stimulation. Left panels: at rest; middle panels: after 40 action potentials (AP) at 10 Hz; right panels: after a brief application of NH4Cl. Responsive terminals are indicated by the black arrows. Pseudocolor scale is shown to the right (min, max:minimum and maximum fluorescence intensity). Scale bar, 10 μm. (c,d) vGpH response to 40 AP at 10 Hz from presynaptic terminals of DRG neurons transfected with Ctrl shRNA (c) or FMRP shRNA (d) before and after treatment with toxins (10 min with ω-conotoxin GVIA (1 μM) and ω-agatoxin IVA (300 nM)). Fluorescence intensities were normalized to the peak of a brief application of NH4Cl. (e) Normalized vGpH responses to 40 AP at 10 Hz from presynaptic terminals of DRG neurons transfected with Ctrl shRNA (black-filled bar, 100±10.6%, n=38) or FMRP shRNA (red open bar, 137.0±12.6%, n=25, P=0.027). ω-conotoxin GVIA (ConoTx, 1 μM) reduces Ctrl shRNA and FMRP shRNA responses to a similar level (44.7±4.9%, n=15 and 41.6±3.3%, n=24, respectively). ω-conotoxin GVIA (1 μM) and ω-agatoxin IVA (AgaTx, 300 nM) application reduces further the responses: Ctrl shRNA=17.3±3.2%, n=38, and FMRP shRNA=18.1±5.0%, n=27. A dot plot graph for the data is presented in Supplementary Fig. 9. Means±s.e.m., *P<0.05; one-way ANOVA. (f) Average vGpH response to a 40 Hz stimulation for 30 s from presynaptic terminals of DRG neurons transfected with Ctrl shRNA (black-filled squares) or FMRP shRNA (open red squares). The decay of the signal after stimulation is well fitted by a monoexponential: τ=20.3±2.3 s for Ctrl shRNA (n=111) and τ=20.9±0.9 s for FMRP shRNA (n=77). Means±s.e.m.

