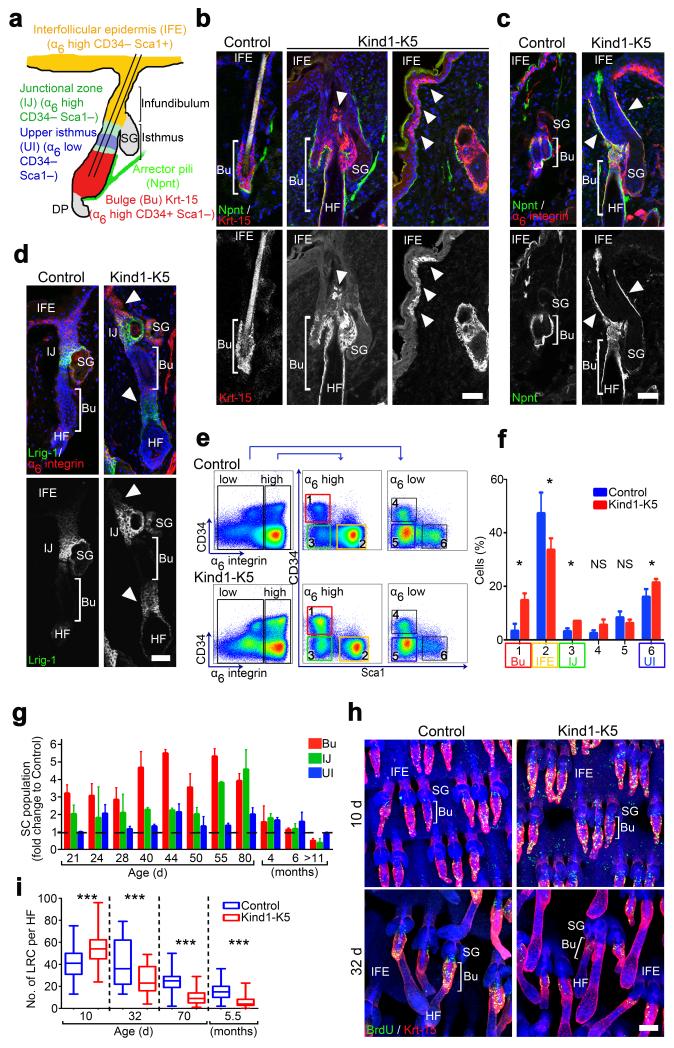
Figure 3.
Kindlin-1 regulates cutaneous epithelial SC homeostasis. (a) Distribution and expression of marker genes in SC subpopulations of murine HFs. (b–d) Back skin immunostaining from 6 months old mice for Krt-15 (red) and Npnt (green) (b), Npnt (green) and α6 integrin (red) (c), and for Lrig1 (green) and α6 integrin (red) (d). Arrowheads indicate Krt-15 positive cells (b), Npnt deposition (c) and Lrig1 expression (d) in Kind1-K5 mice. (e) Keratinocytes from P40 old mice were separated by FACS into α6 integrin-high and -low and further analyzed for CD34 and Sca1 expression. (f) Gated populations (1–6) were quantified and represented as mean ± SD (n=5 Control and 3 Kind1-K5 mice). Color code in (e–f) corresponds to the cell population denoted in (a). (g) The relative amounts of SC subpopulations over time analyzed by FACS. Data show average fold increase (± SD) relative to control mice (n and P-values are listed in Supplementary Table 1). (h) BrdU (green) retaining cells in Krt-15 (red) stained tail whole mounts after indicated chase times. (i) Numbers of LRC per HF after indicated chasing periods were quantified as boxplots (10 d n=5 Control and 3 Kind1-K5; 32 d n=3 Control and 4 Kind1-K5; 80 d n=4 Control and 3 Kind1-K5). Boxplot whisker ends show Min/Max distribution and middle line reports the median. Nuclei are stained with DAPI (blue) (b–d,h). Scale bar indicates 50 μm (b–d) and 100 μm in (h). Bu, bulge; SG, sebaceous gland; HF, hair follicle; IFE, interfollicular epidermis; UI, upper isthmus; IJ, infundibulum junctional zone.

