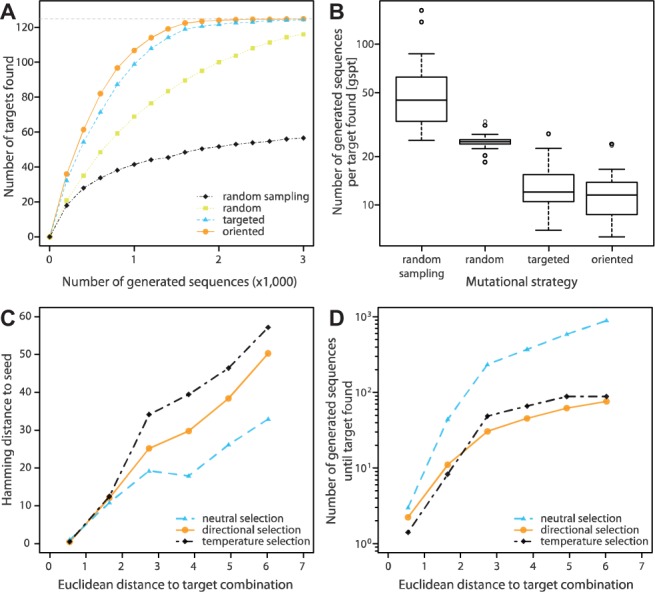
Fig. 4.

D-Tailor design simulations. (A) We performed simulations of full-factorial design using 30 different initial sequences (seeds) and four different design strategies: random sampling (black) and heuristic search using random (yellow), targeted (blue) and oriented (orange) mutations. The different lines represent the average number (across 30 simulations) of target combinations found (out of 125) as a function of the number of generated sequences (up to 3000) for the four different strategies. We observed sizeable variation between seeds (not shown for clarity, see Supplementary Material for details). (B) Number of generated sequences per target found (gspt) for the four different mutational strategies (n = 30). (C) We used the same 30 different seeds to find six different target combinations at various Euclidean distances. The different lines show the average hamming distance between the seed and the sequence matching the target combination as a function of the Euclidean distance to the target combination using neutral (light blue), directional (orange) or temperature selection (black). (D) The number of generated sequences until the desired target is found as a function of the Euclidean distance to the target combination using either neutral (light blue), directional (orange) or temperature (black) selection
