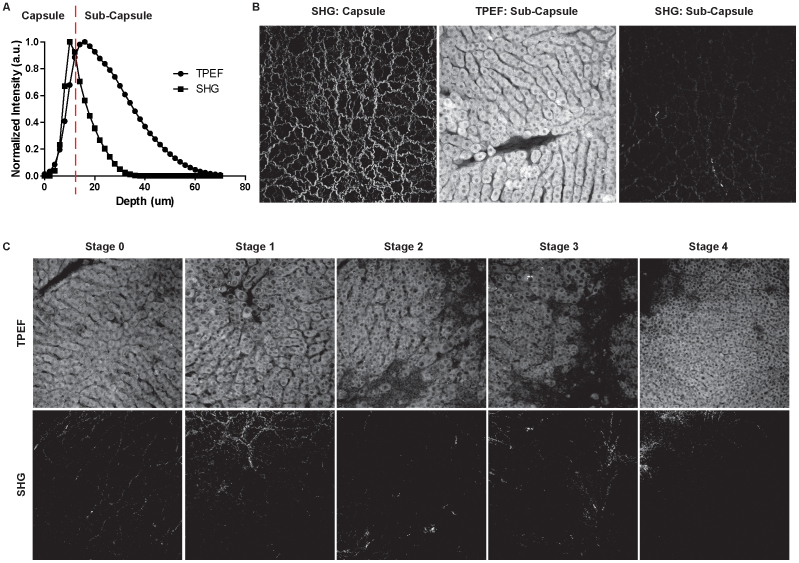
Figure 1. SHG & TPEF imaging on the liver surface.
(a) SHG & TPEF signal intensity at liver surface in respect to the position of the Glisson's capsule; (b) SHG image collected in the Glisson's capsule region and highest signal intensity TPEF and SHG images collected in the sub-capsule region. The cellular structures that can be observed in the TPEF image are complementary to the collagen information in the SHG image. (c) Pairs of TPEF & SHG images on fibrotic liver tissue from Stage 0 to Stage 4 collected in the sub-capsule region. The TPEF images show that in the normal liver the hepatocytes are well aligned along the sinusoidal spaces. In the course of fibrosis progression, such alignment is destroyed with enlarged nuclei size and nuclei to cell ratio. The tissue structure becomes messy with larger empty spaces occupied by deposited collagen. The collagen structures are not obvious in the corresponding SHG images due to the low signal intensity. Field-of-view size is 450µm x 450µm.

