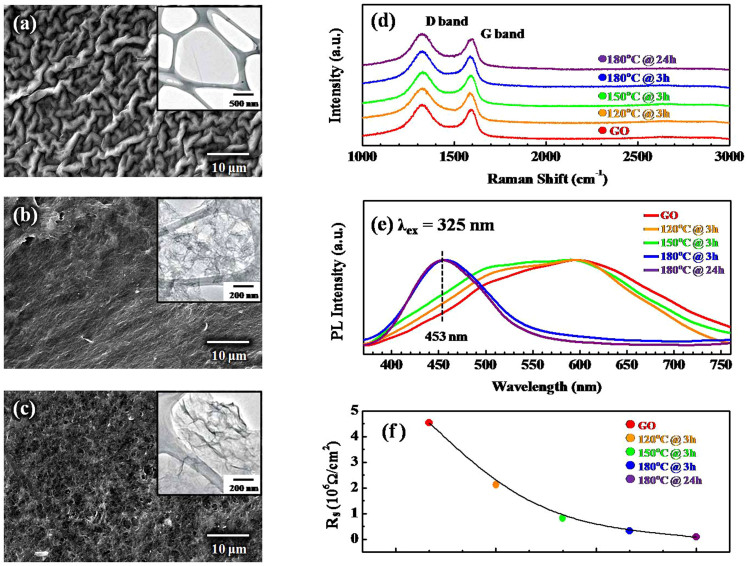
Figure 1.
SEM images of (a) the as-synthesized GO, (b) the rGO formed at 150°C@3 hr, and (c) the rGO formed at 180°C@24 hr. The insets show the respective TEM images. (d) The Raman spectra were obtained at an excitation wavelength of 633 nm. (e) The normalized photoluminescence spectra of the GO and rGOs reduced at different temperatures for different periods, and (f) the sheet resistances of the GO and rGOs reduced at different temperatures for different periods.

