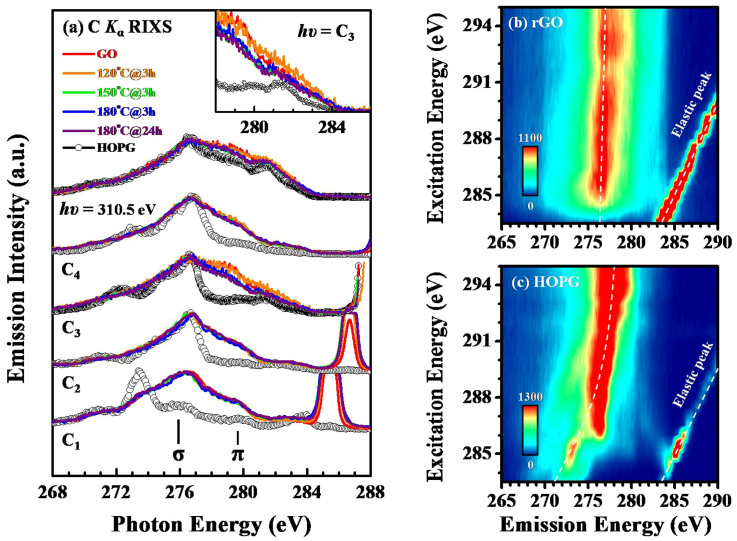
Figure 4.
(a) The normalized C Kα RIXS spectra of the GO, rGOs and HOPG obtained by excitation at photon energies of 285.5 eV (C1), 286.6 eV (C2), 287.9 eV (C3), 288.7 eV (C4) and 310.5 eV. Notably, the resonance features in the lower right-hand corner are the elastic peaks. (b) 2d-RIXS mapping of rGO (180°C@24 h) and (c) HOPG as functions of both the excitation and emission energies.

