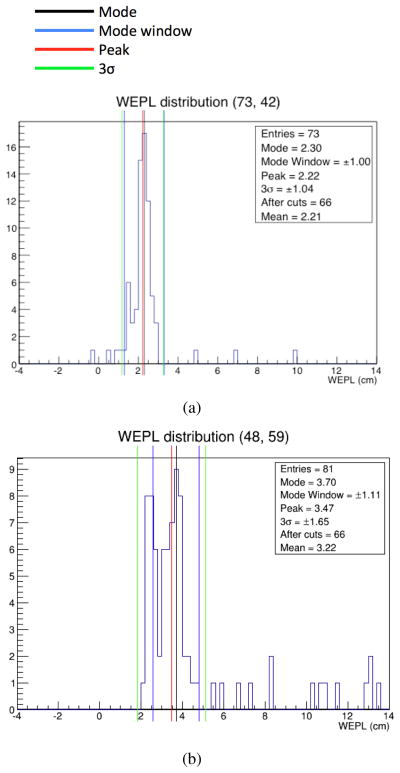
Fig. 5.
Distribution in WEPL for pixels described by the coordinates 5(a) (t = 73, v = 42) and 5(b) (t = 48; v = 59) before cuts were made. The black line defines the mode of the distribution and the red line defines the mean or “peak” of the distribution. The blue lines indicate the mode window which contains the particles within ±30% of the mode, and provides the distribution on which the 3σ cuts were based. The green lines indicate the cuts made on this specific pixel. Notice the straggling in the large WEPL range. These values correspond to particles that underwent nuclear interactions. 5(a) illustrates an example of a roughly gaussian WEPL distribution. 5(b) is that for a boundary pixel with a bimodal WEPL distribution.

