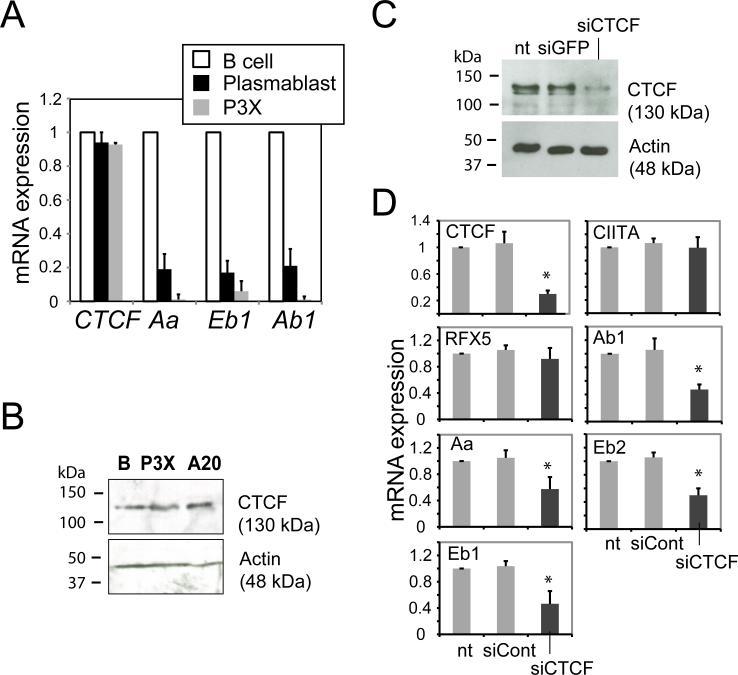
Figure 3. Expression of mouse MHC-II genes are specifically reduced in CTCF depleted splenic B cells.
A) Total RNA was purified from splenic B cells, LPS-induced plasmablasts, and P3X cells, and the mRNA level of the genes indicated was determined. B) CTCF protein levels were assessed in whole cell lysates from B cells, P3X, and A20 cells by western blotting using anti-CTCF and anti-actin antisera. C) At 72 h post-transfection of primary murine splenic B cells with CTCF or GFP (control) siRNAs, a western blot was performed to assess the degree of CTCF expression/knockdown. D) From the siRNA transfections in (C), mRNA levels of the indicated genes were determined by real-time RT-PCR using RNA prepared from untreated cells (nt) and cells transfected with CTCF or control siRNAs. Data from three biological replicates are presented as relative mRNA expression with respect to the no treatment lane (nt). Standard error is presented along with student's t-test comparisons between siRNAs to GFP and CTCF. An asterisk (*) indicates P values <0.05 between samples treated with siRNAs against GFP and CTCF.

