
Fig. 3.
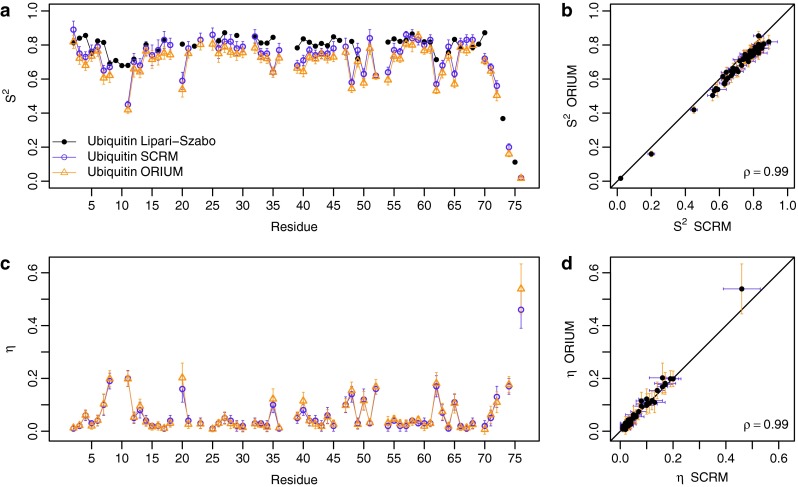
Comparison of ORIUM (yellow) and SCRM (violet) derived N–HN and η parameters for ubiquitin. For both ORIUM and SCRM, the estimated error comes from 1,000 Monte Carlo simulations that add uncertainty to the RDCs drawn from a Gaussian distribution with a standard deviation given by the error in the RDC set (0.3 Hz). a plot by residue. The black line represents the parameters (Chang and Tjandra 2005). b correlation plot. c η plot by residue. d η correlation plot