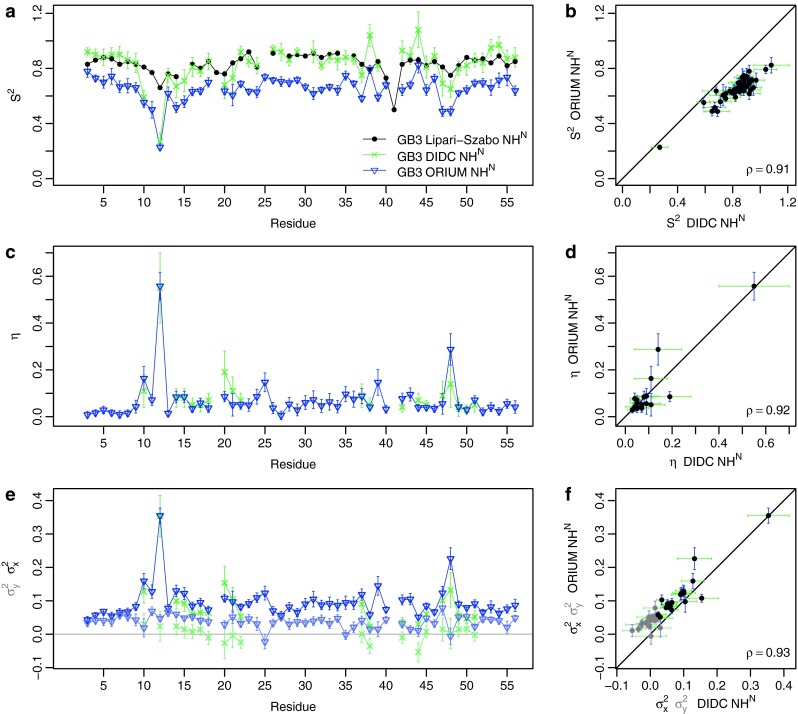
Fig. 4.

Comparison of ORIUM (blue) and iterative DIDC (green) derived N–HN and η parameters for GB3. The ORIUM calculation was performed with only the N–HN RDCs. For ORIUM, the estimated error results from 1,000 Monte Carlo simulations that add uncertainty to the RDCs drawn from a Gaussian distribution with a standard deviation given by the error in the experimental RDCs reported in the iterative DIDC publication of 0.2 Hz. From the iterative DIDC analysis, 100 Monte Carlo simulations were performed with an uncertainty of 0.3 Hz and η is determined only for residues that were not fit to an isotropic motional model (Yao et al. 2008). a plot by residue. The solid line represents the parameters (Hall and Fushman 2003). b correlation plot. c η plot by residue. d η correlation plot. e and (lighter colors) by residue. f and (lighter colors) correlation plot
