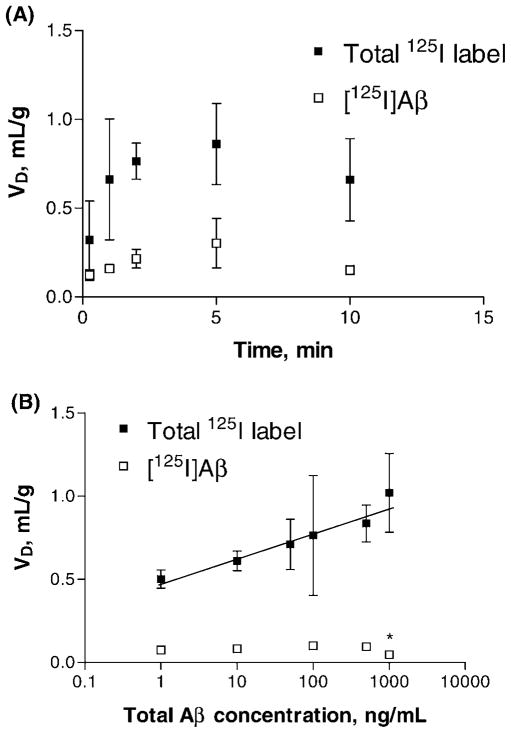
Figure 1.
Accumulation of β-amyloid (Aβ) in isolated rat choroid plexus. Volume of distribution values (VD) corrected by a space marker [14C]sucrose are presented as means ± SEM. Some samples were filtered to remove free iodine and small Aβ fragments and retain only [125I]Aβ (open squares). Unfiltered samples are denoted as total 125I label (filled squares). (A) Time course of Aβ uptake. The uptake was linear up to 5 mins by regression analysis for both curves (n = 3–4 per time point). (B) Concentration study of Aβ uptake (n = 3–4). The linear regression of total 125I label had a positive correlation (r = 0.96, P = 0.002). *Significant reduction (P < 0.05) versus 500 ng/ml.

