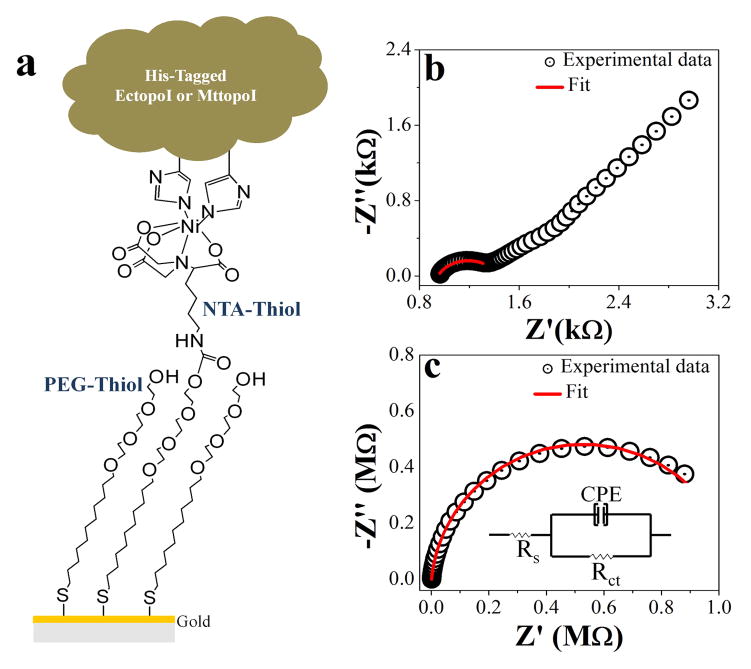
Figure 1.
a) Scheme showing the sensor surface modification with mixed thiols followed by the His-tagged EctopoI/MttopoI immobilization. b) Electrochemical Impedance Spectroscopy (EIS) for the bare gold. c) EIS for SAM modified gold surface, inset: equivalent circuit for EIS data fitting and analysis. A frequency range from 10−1 Hz to 104 Hz was used during EIS measurements. In both Figures b and c, the symbols are experimental data and continuous lines are the CNLS fit (see supplementary information, section S1, for details).

