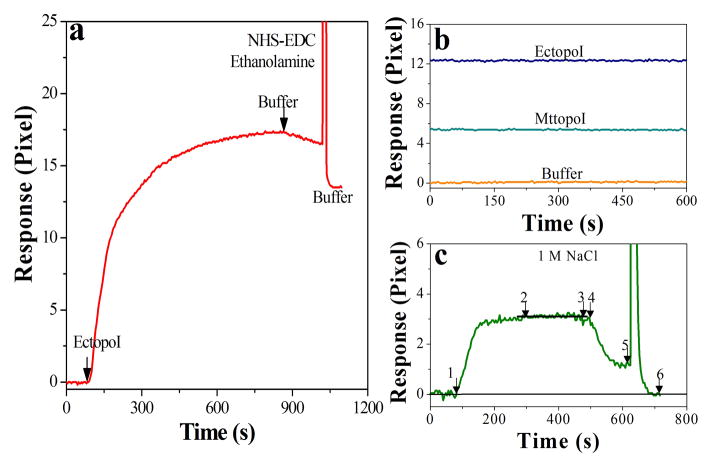
Figure 2.
a) SPR sensorgram for the immobilization of EctopoI via capture covalent method. The arrows show the start of immobilization and buffer wash. b) Representative SPR signals showing stability of sensor surface; with buffer before enzyme immobilization and after capture covalent immobilization of the enzymes. c) Representative SPR profile for enzyme-pBAD/Thio interaction: 1 to 2 association, 2 to 3 saturation, 3 to 4 minor signal shift due to manual changing of valve, 4 to 5 dissociation, and 5 to 6 regeneration.

