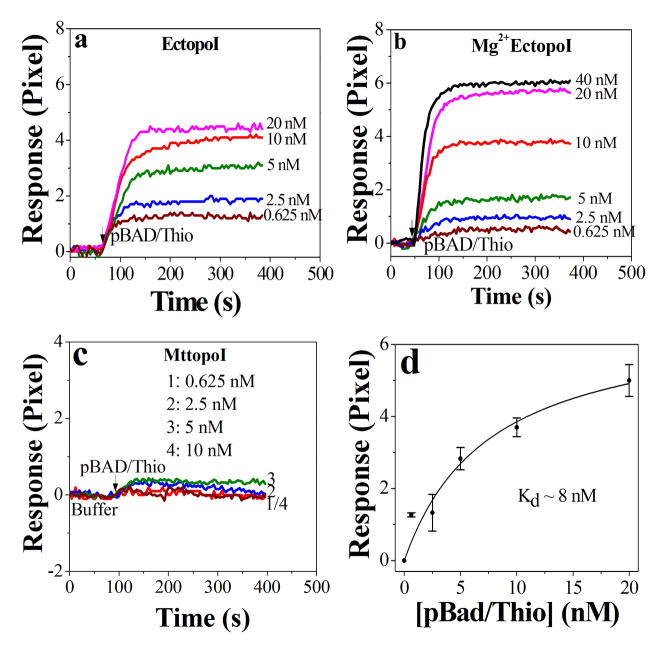
Figure 3.
SPR sensorgrams for a) pBAD/Thio binding to EctopoI, b) for pBAD/Thio binding to Mg2+ bound EctopoI and c) for pBAD/Thio binding to MttopoI. d) Plot of equilibrium SPR response vs pBAD/Thio concentration. The symbols are average experimental data of three different measurements with error bars as standard deviation and the continuous lines are the simple hyperbolic fit (explained in text).

