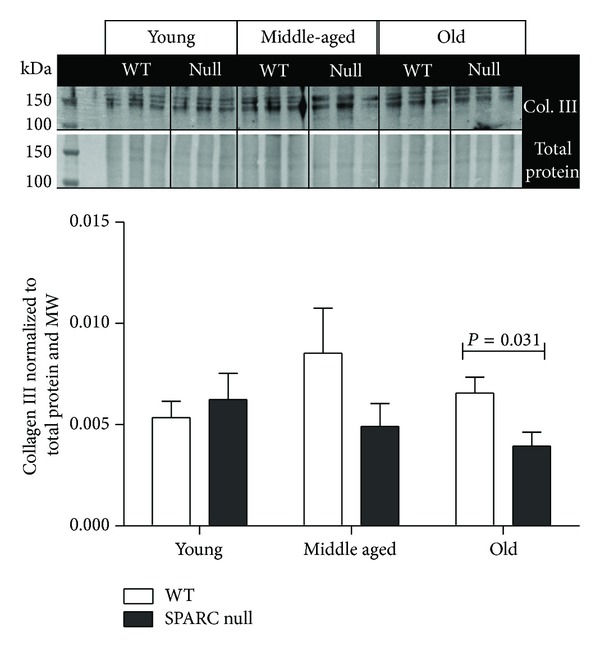
Figure 2.

In the old mice, LV collagen III levels were lower in the SPARC null mice compared to the WT. Protein levels were quantified by immunoblot (n = 6/genotype/age). Two controls were used, total protein stain (loading control) and molecular weight marker (MW, blot to blot control). The signal intensity of the MW was used to normalize the data among blots, while protein levels were normalized to the total protein in its respective lane. Values were plotted as mean ± SEM.
