
Figure 3.
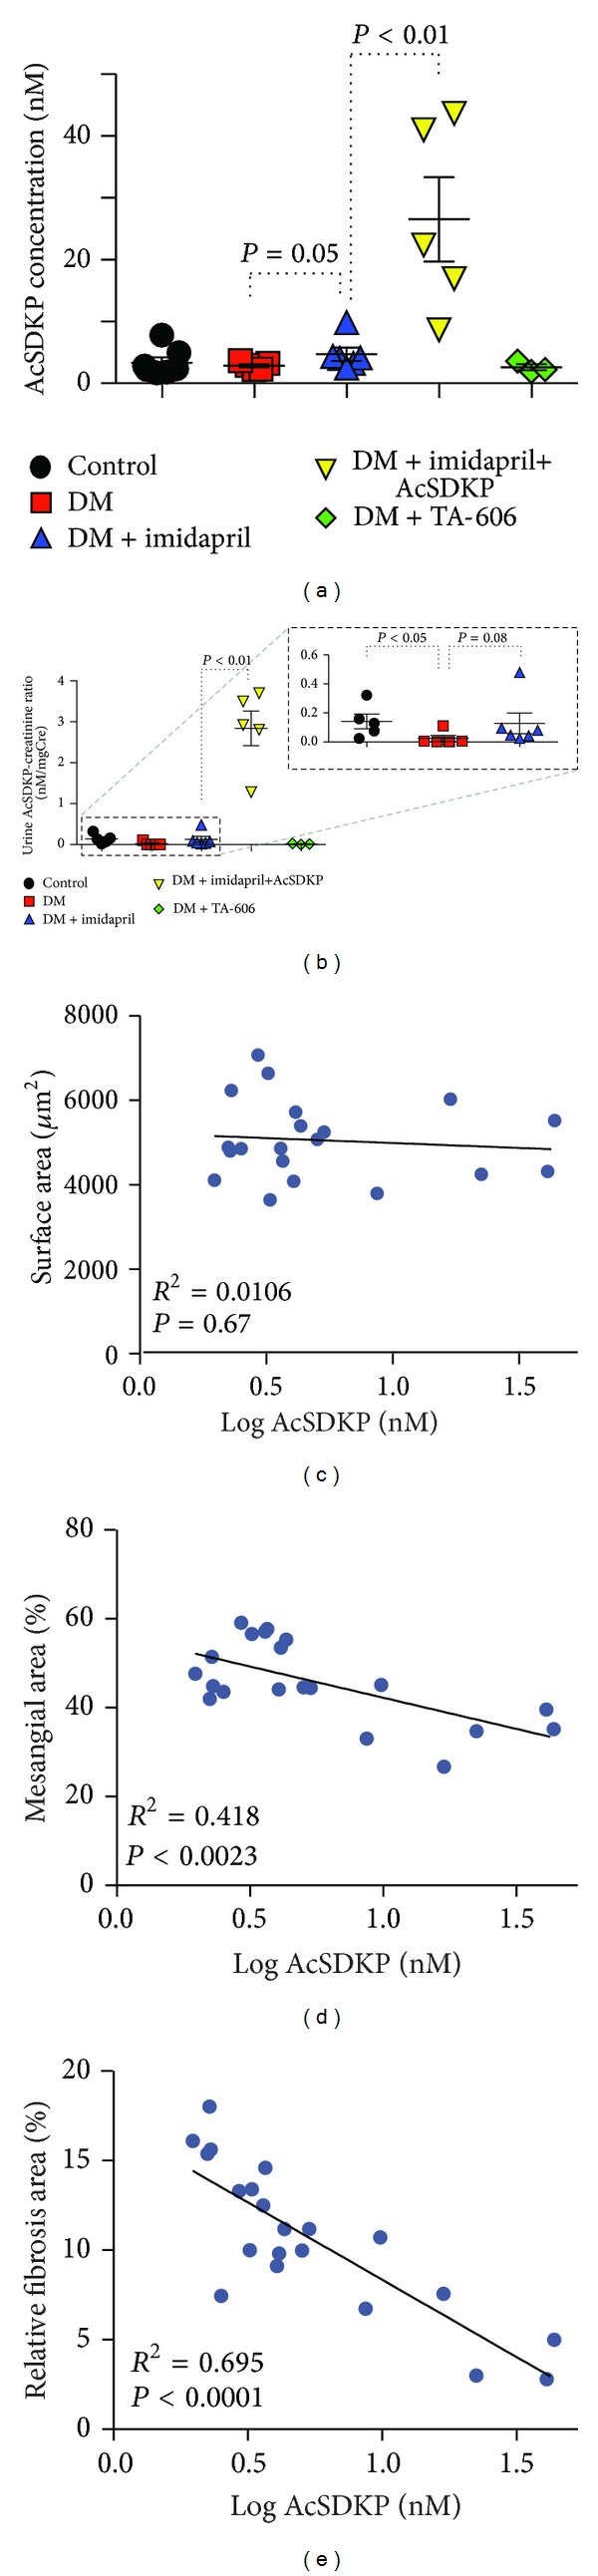
Negative correlation between the concentration of AcSDKP and mesangial area or relative fibrosis area. (a) Plasma concentration of AcSDKP in the indicated group of mice. (b) Urinary AcSDKP/creatinine ratio. Inset in (b) shows an enlargement of the dotted square area of the graph. The data are expressed as the mean ± SEM values. Diabetes is designated as DM. Control: n = 7 (urine, n = 5), STZ-induced diabetes: n = 5, diabetes treated with imidapril: n = 6, diabetes treated with imidapril+AcSDKP: n = 5, diabetes treated with TA-606: n = 3. ((c)–(e)) Linear regression analysis of the relationship between the plasma AcSDKP concentration and the values for the morphometric parameters. Glomerular surface area (c), relative mesangial area (d), and relative fibrosis area (e) are shown. The AcSDKP levels were plotted using a log conversion. Only diabetic animals were analyzed.