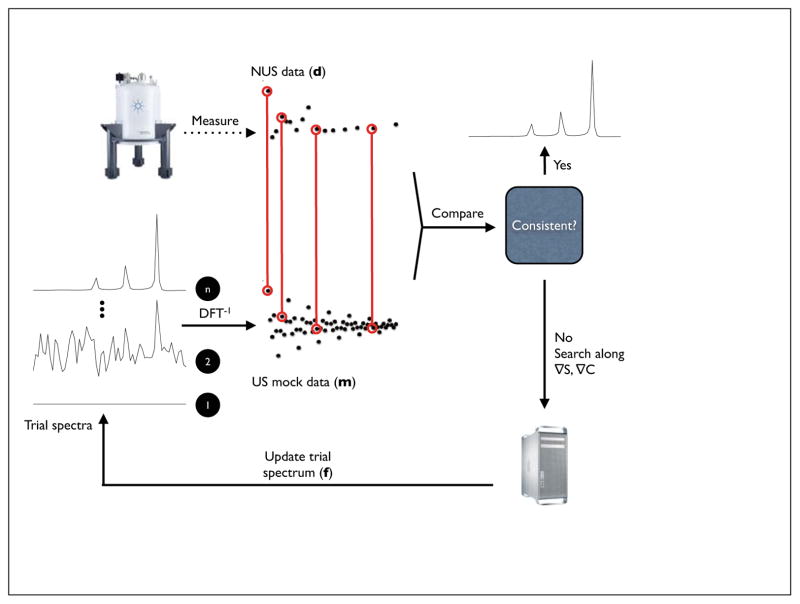
Figure 1. Schematic diagram for MaxEnt.
MaxEnt reconstruction begins with empirical data and a preliminary trial spectrum f (typically a blank spectrum). f is inverted (DFT−1) to create “mock” data (m) that is compared with the empirical data (d). An update to the trial spectrum is computed by searching along the gradients of the entropy and the constraint (the agreement between the empirical and mock data). The algorithm converges to the unique MaxEnt solution when the gradient of the objective function O = S-λC is zero and the gradients of S and C are antiparallel.

