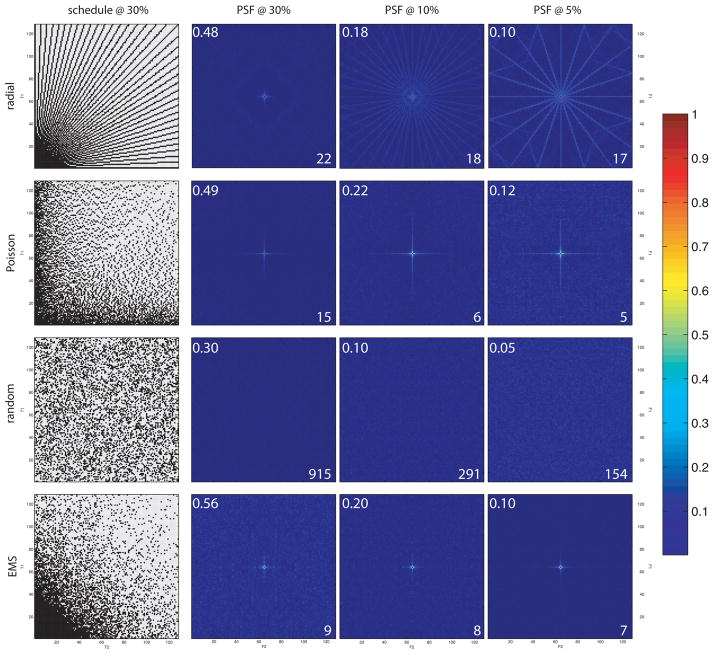
Figure 3. Examples of NUS schemes and PSFs.
Examples of NUS sampling functions and PSFs in two nonuniformly sampled dimensions. Purely random sampling (third row) yields the smallest sampling artifacts for a given level of coverage (the central zero-frequency component is extremely narrow, making it hard to discern the red dot). Values for the relative sensitivity and PSR (both unitless) are displayed in the upper left and lower right, respectively, for each PSF.

