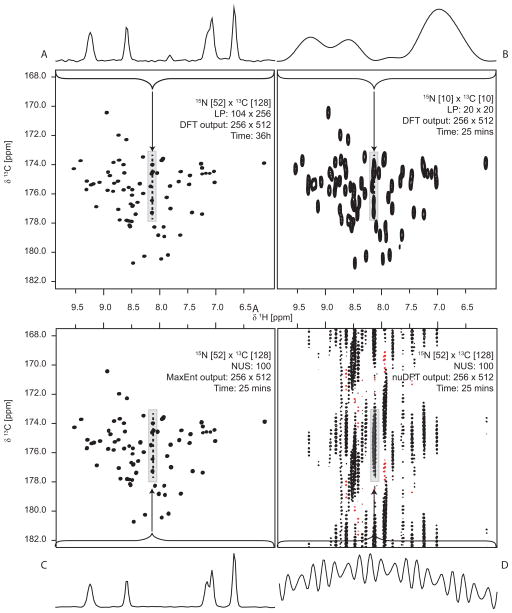
Figure 5. 3D HNCO spectra for Ubiquitin at 14.1 T (600 MHz for 1H).
Projections of the full spectrum onto the 13C/1H plane. The one-dimensional cross-sections through the plots are expansions depicted by the rectangular boxes, scaled to align the maxima and minima. A) Using the full 6656 sample data set, processed using LP extrapolation in the indirect dimensions, shifted sine-bell apodization, and DFT (36 hours of data collection) B) using 400 uniformly-sampled data points (20 increments in each indirect dimension, 25 minutes of data collection). The spectrum was computed by LP extrapolation in each indirect dimension, apodization using a shifted sine-bell, and DFT. C) using NUS, with 400 random samples selected according to an exponentially weighted distribution, reconstructed using MaxEnt; this data also requires 25 minutes of data collection. D) Same as C), except using nuDFT instead of MaxEnt.

