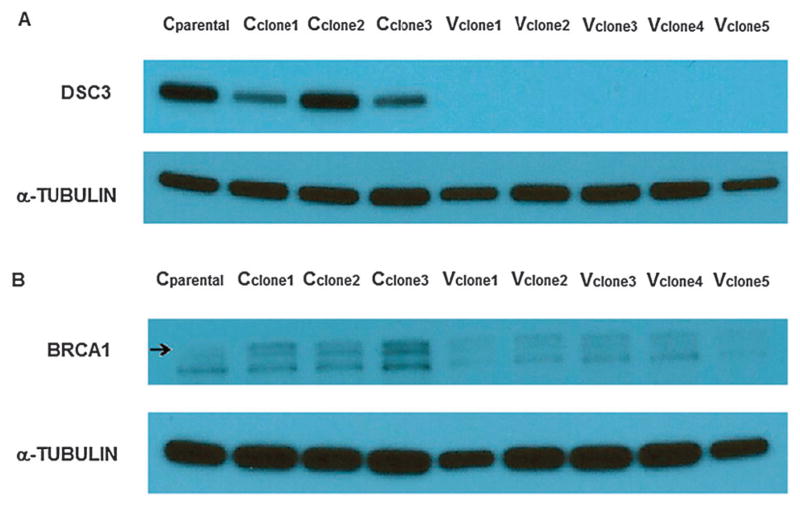
Fig. 8.
Western blots for DSC3 and BRCA1. α-tubulin was identified at approximately 50 kDa. (A) DSC3 was identified at approximately 100 kDa, There was a clear reduction of DSC3 in the Vclones compared to the Cclones. (B) BRCA1 was identified at approximately 207 kDa (upper band). BRCA1 was underexpressed in Vclones compared to Cclones.

