
Fig. 1.
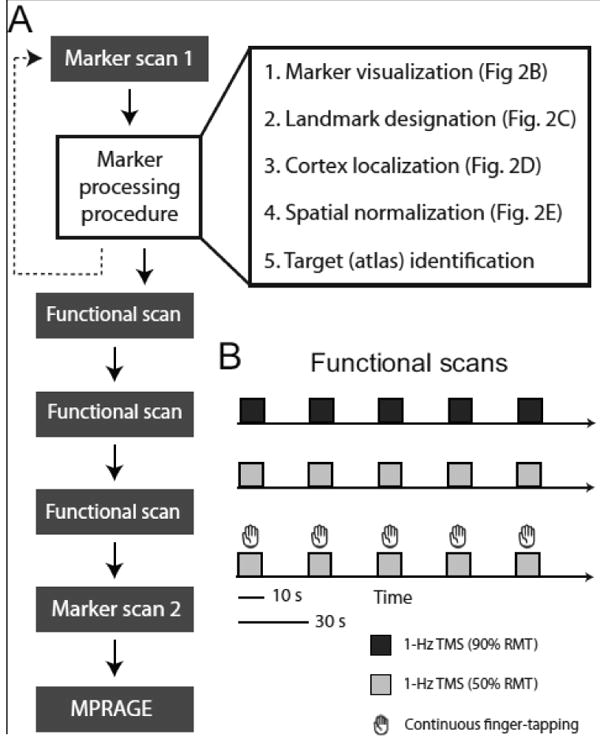
Experimental design. A) Flowchart of scan sequence and marker processing procedure steps. Graphical depictions of each processing step are provided in Fig. 2. B) Schematic of functional scans. In a block-design, subjects received 10-s trains of high-intensity (90% resting motor threshold (RMT)) or low-intensity (50% RMT) sub-threshold rTMS (1-Hz). In a separate scan, subjects performed 10-s blocks of continuous finger-tapping cued by low-intensity TMS (Materials and methods).