
Fig. 6.
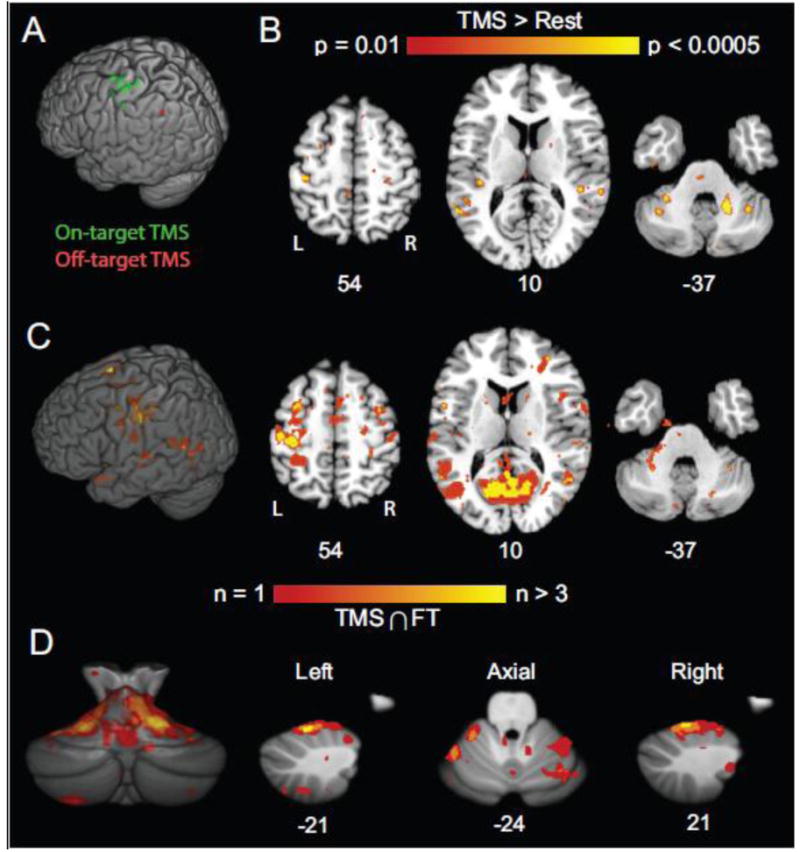
Validation results from concurrent TMS-fMRI experiments. A) Estimates of stimulated sites (Green marks indicate on-target stimulation; Red mark indicates off-target stimulation). B) Activation pattern (high-intensity TMS > Rest) for example subject. Coordinates indicate plane in MNI atlas space. C) Population map showing conjunction of significant activations related to TMS and cued motor responses (Materials and methods). Color scale indicates number of subjects with significant conjunctions (p < 0.0001) at each voxel. TMS and cued motor performance yielded overlapping activations in distributed cortical and subcortical networks. D) Population map of the cerebellum showing conjunction of activations related to TMS and cued motor responses. Conventions as in C.