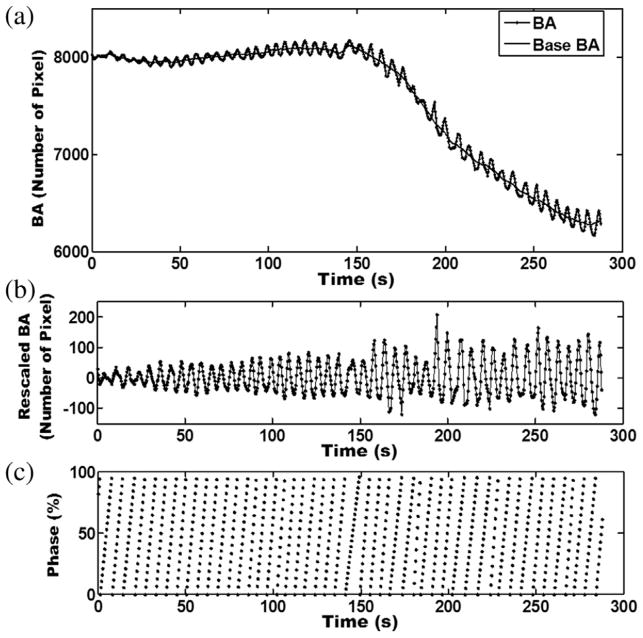
Fig. 1.
Examples of (a) body area (BA) and base BA curves, (b) rescaled BA curve by subtracting BA from base BA, and (c) respiratory phase measured using the BA method. Four-dimensional magnetic resonance images were acquired in axial planes; each slice was imaged continuously throughout the breathing cycle. The BA was determined for each image. For each image slice an individual breathing curve was generated by plotting BA as a function of image acquisition time. The BA curve was generated by plotting all individual breathing curves as a function of acquisition time.

