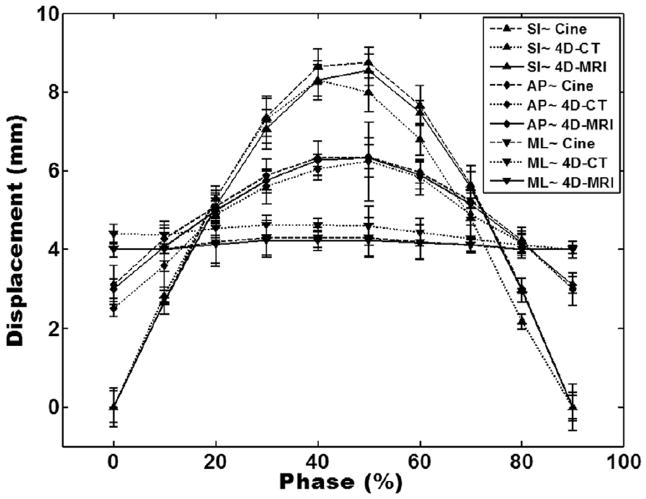
Fig. 4.
Comparison of tumor motion trajectories from cine-MRI (magnetic resonance imaging), 4-dimensional (4D) computed tomography (CT), and 4D-MRI in orthogonal planes (superior–inferior [SI], anterior–posterior [AP], and medial–lateral [ML]). Error bars are standard deviations of multiple measurements in 4D computed tomography and 4D-MRI and are standard deviations of multiple breathing cycles in cine-MRI. Each of the 30-second-long tumor motion trajectories of the single-slice cine MRI was processed to generate average tumor motion trajectories that contain only 1 breathing cycle for motion comparison.

