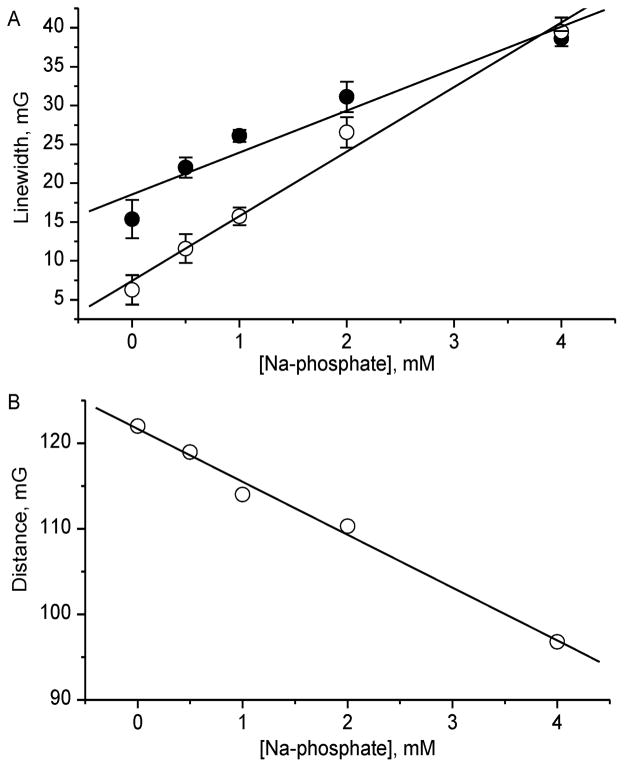
Figure 6.
(A) Dependencies of the Lorentz linewidths of p1TAM3– (●) and p1TAM4– (○) components of p1TAM-D probe on phosphate buffer concentration. Solid lines represent the best linear fits with the slopes of (5.4 ± 0.8) mG/mM and (8.3 ± 0.5) mG/mM for p1TAM3– and p1TAM4– forms, correspondingly. (B) Dependence of distance between p1TAM3– and p1TAM4– components of p1TAM-D probe on phosphate buffer concentration. The solid line is the best linear fit with the slope of (6.2 ± 0.3) mG/mM.

