
Figure 6.
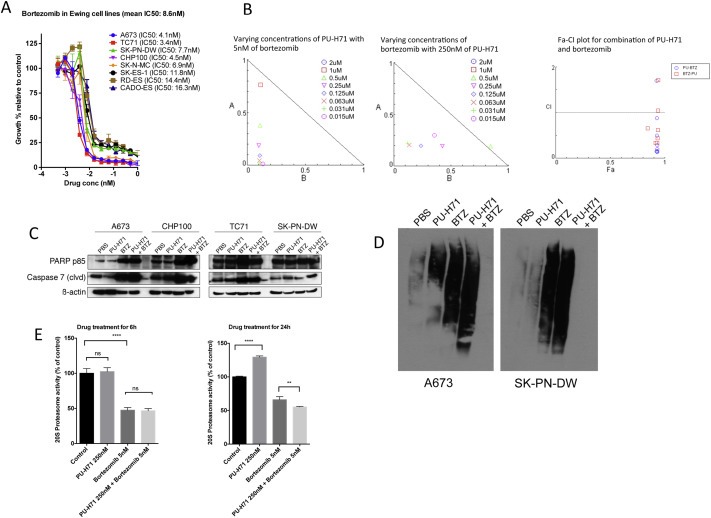
Combination of PU‐H71 and bortezomib exhibits synergism against Ewing sarcoma cells in vitro. A, Alamar blue proliferation assay of cell lines treated with varying concentrations of bortezomib (from 1 μM to 0.00048 μM) for 72 h (n = 3 experiments, each in triplicate). B, Normalized isobologram created with Compusyn software for combination of varying concentrations of PU‐H71 and IC50 of bortezomib and vice versa. Also, shown is the Fa‐combination index (CI) plot for the combinations. C, Western blot for PARP p85 and cleaved caspase 7 in 4 cell lines‐A673, CHP100, TC71 and SK‐PN‐DW treated with PBS, PU‐H71, bortezomib and combination of PU‐H71 and bortezomib for 24 h. D, immunoblot analysis of ubiquitinated proteins in A673 and SK‐PN‐DW cells treated with PBS, PU‐H71, bortezomib and combination of PU‐H71 and bortezomib for 24 h. E, A673 cells were treated with PBS, PU‐H71 250 nM, bortezomib 5 nM and combination of PU‐H71 250 nM and bortezomib 5 nM for 6 h and 24 h and their proteasome activity was measured (experiments were conducted in triplicate).