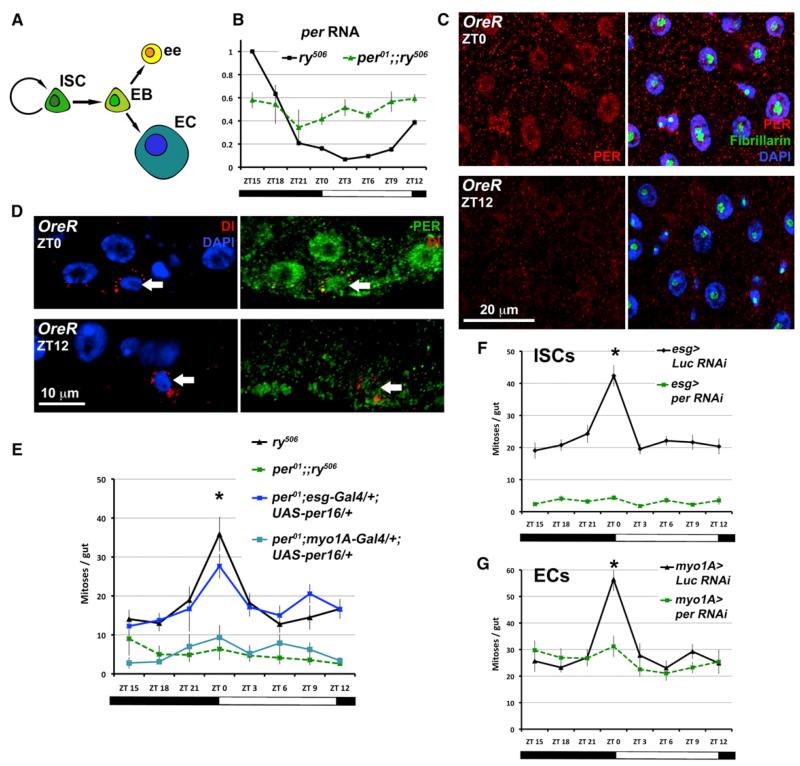
Figure 1. PER Cycles and Functions in the Damaged Intestine.
(A) The ISC lineage. ISC, intestinal stem cell; EB, enteroblast; ee, enteroendocrine cell; EC, enterocyte.
(B) per RNA expression (qPCR) in the intestine over ZT, with ZT0 denoting when lights are turned on. The ry506 control normally shows circadian rhythms, but these are absent in per01 mutants. Graph shows the average of two separate experiments (n = 15 guts/genotype/time point, expression normalized to ry506 ZT15, relative to GAPDH RNA; error bars ± SEM).
(C) PER staining (red) shows nuclear accumulation in intestinal cells in the morning (ZT0) versus the evening (ZT12). Fibrillarin (green) marks the nucleolus, where PER is weaker.
(D) PER protein levels are rhythmic in ISCs (arrows) labeled with Delta (Dl, red).
(E) When flies are maintained in LD conditions (see Figure S1C for schematic), control (ry506) intestinal mitoses peak at ZT0, in contrast to per01. A UAS-per rescue construct expressed in ISCs using esg-Gal4 rescues this effect partially in the per01 background.
(F) Rhythms are present in Luciferase (esg > Luc RNAi is esg-Gal4/+; UAS-dcr2/UAS-Luc RNAi) controls, but PER knockdown in ISCs (esg > per RNAi is esg-Gal4/+; UAS-dcr2/UAS-per RNAi) phenocopies per01.
(G) PER knockdown in ECs also disrupts circadian mitotic rhythms (genotypes as above but with myo1A-Gal4/+).
See also Figures S1, S2, S3, and S5.

