
Figure 4.
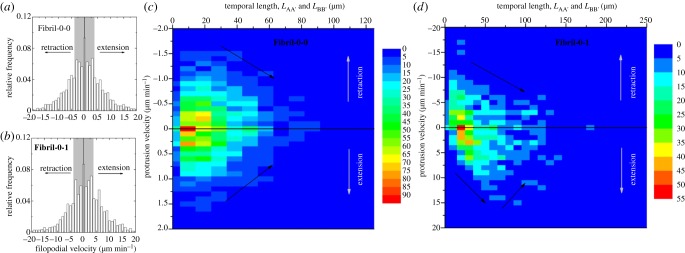
(a,b) Histograms of protrusion velocity for Fibril-0-0 and Fibril-0-I, respectively. The shaded area in each histogram indicates a 50% population. (c,d) Maps of protrusion velocity versus temporal length for Fibril-0-0 and Fibril-0-I, respectively, where the colour scale indicates the number of occurring events. It is to note that a positive velocity indicates protrusion extension, and a negative velocity indicates retraction. The trend of change in protrusion velocity w.r.t. length is indicated by black arrows.