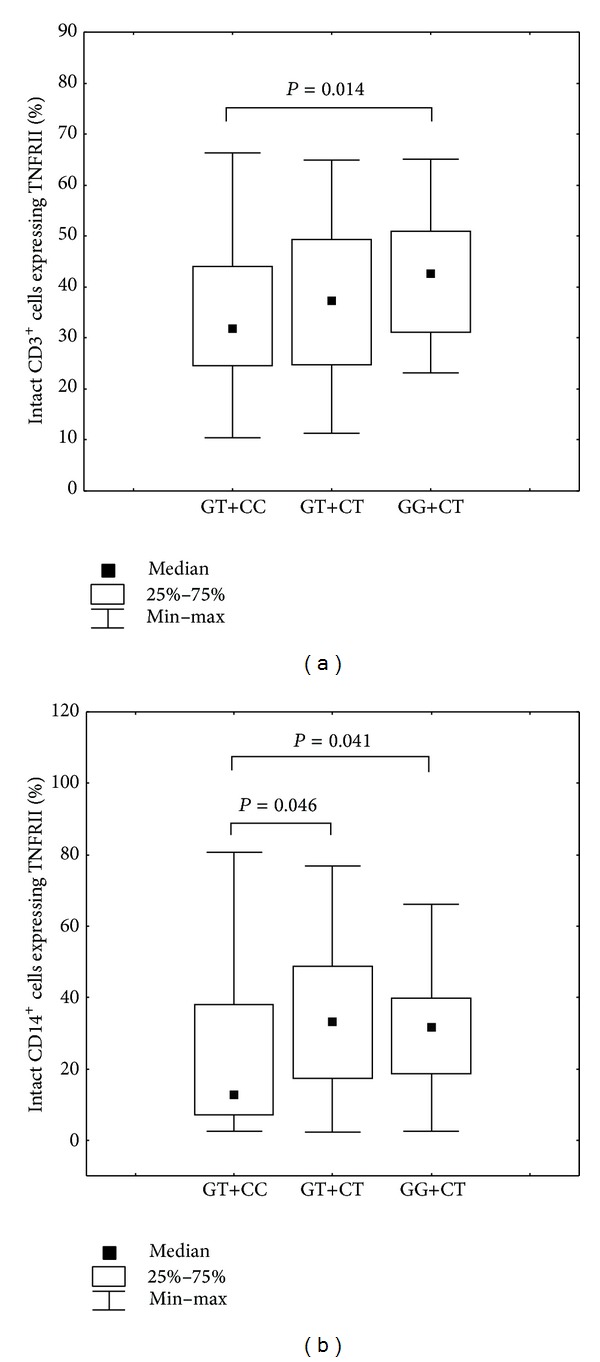
Figure 5.

(a) Percentage of CD3+ cells expressing TNFRII in individuals presenting with different genotypes combinations of SNPs TNFRI −609G/T (rs4149569) and TNFRII −3609C/T (rs590368). Kruskal-Wallis H test, P = 0.048, Mann-Whitney U test: GT+CC versus GG+CT, P = 0.01. (b) Percentage of CD14+ cells expressing TNFRII in individuals with different genotypes combinations of SNPs TNFRI −609G/T (rs4149569) and TNFRII −3609C/T (rs590368). Mann-Whitney U test: GT+CC versus GT+CT, P = 0.046, GT+CC versus GG+CT, P = 0.04.
