Figure 3.
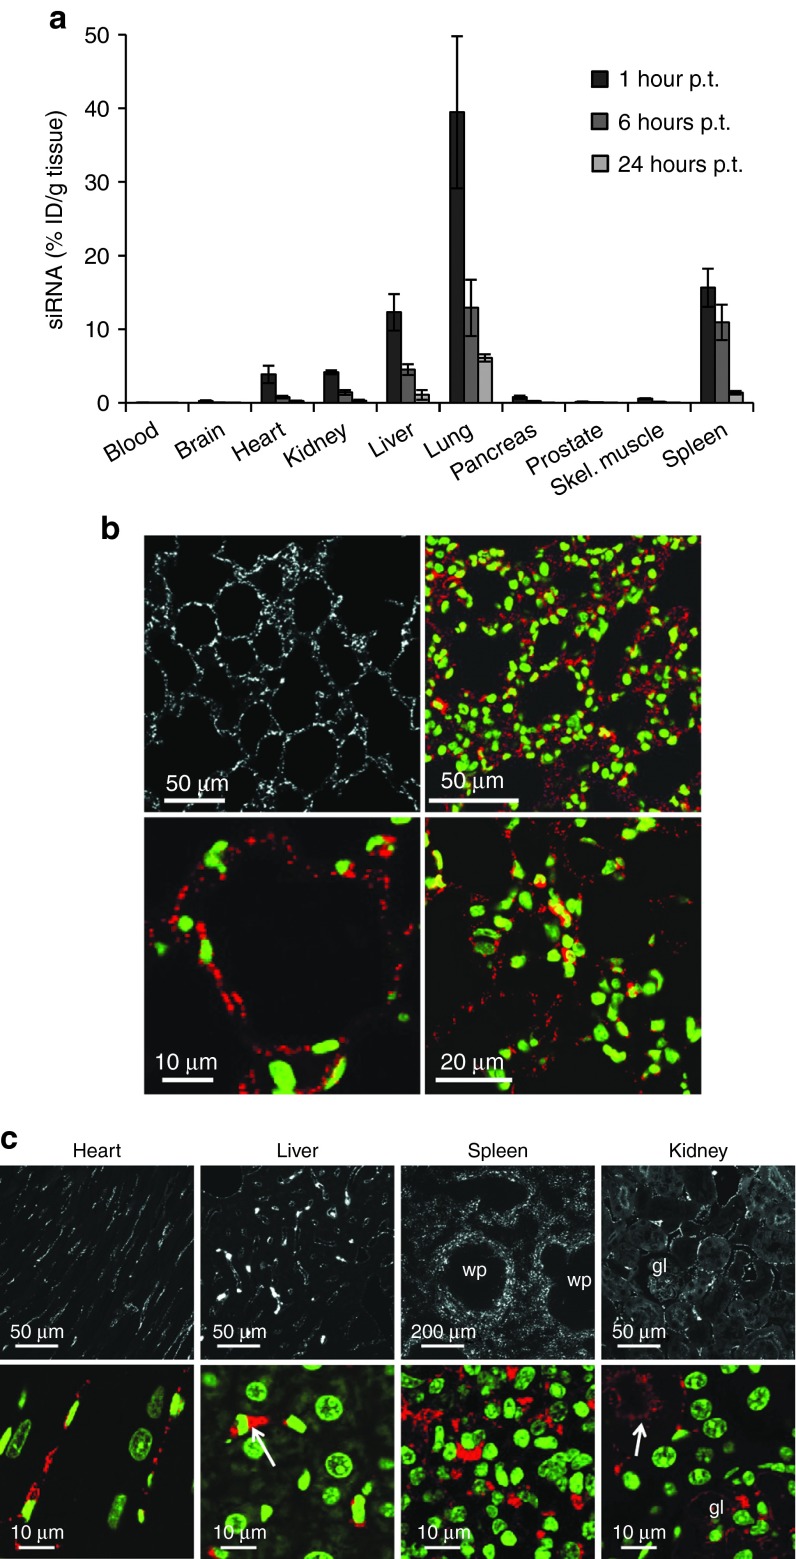
Enhanced siRNA delivery to lungs using DACC lipoplexes, and cellular distribution of Cy3-labeled siRNA in heart, liver, spleen, and kidney 1 hour after systemic i.v. administration of DACC lipoplexes. (a) Mice received a single dose of DACC/siRNAPKN3 via tail-vein injection (2.8 mg siRNA/kg body weight). siRNA concentrations were determined at 1, 6, and 12 hours post treatment (p.t.) (n = 3) by capture probe ELISA assay. Mean values with standard deviation are depicted. Highest siRNA concentration (%ID/g tissue) was found in the lungs 1 hour p.t. (b) Cellular distribution of Cy3-labeled siRNA in the lungs 1 hour after systemic i.v. administration of DACC/siRNACy3. Confocal microscopic images of formaline fixed paraffin embedded lung tissue sections are shown. The upper left panel shows siRNA-Cy3 staining in white, the upper right panel and the lower panels show close up views of siRNA-Cy3 staining in red and nuclear staining in green. siRNA staining is evenly distributed in the lung vasculature. Scale bars are indicated. (c) siRNA-Cy3 staining of paraffin embedded sections of the heart, liver, spleen, and kidney is depicted in white at low magnification (upper panels), and in red in close up views (lower panels). Nuclei are counterstained with Sytox G (Molecular Probe) depicted in green in lower panels. Heart tissue shows siRNA-Cy3 labeling in capillaries. In the liver sinusoids are weakly, Kupffer cells are strongly Cy3 stained (arrow), but not hepatocytes. Distinct siRNA-Cy3 signal is visible in the spleen only in the marginal zones of the white pulp, (wp), upper panel and close up view lower panel. In the kidney, Cy3 signals are prominent in peritubular capillaries and in luminal side of tubules (see arrow). gl indicates glomerulus.

