
Figure 8.
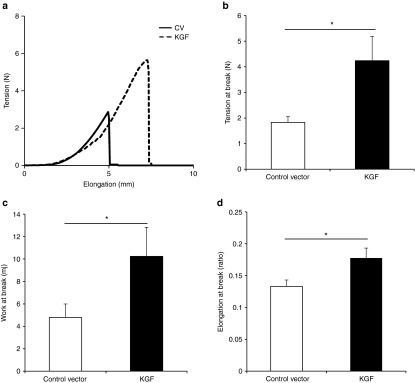
Biomechanical assessment of KGF-1–treated skin. (a) Sample representation of tension–elongation curve comparing KGF-1– to control vector–treated tissue 7 days after the initial treatment. (b) Comparison of the average tension at the breaking point of the KGF-1 and control groups (mean ± SEM, n = 10; *P < 0.05, Mann–Whitney analysis). (c) Average work at the breaking point of both groups (calculated from the integral of the curve; *P < 0.05, Mann–Whitney analysis). (d) Average elongation at the breaking point of both groups (*P < 0.05, t-test). KGF-1, keratinocyte growth factor-1.