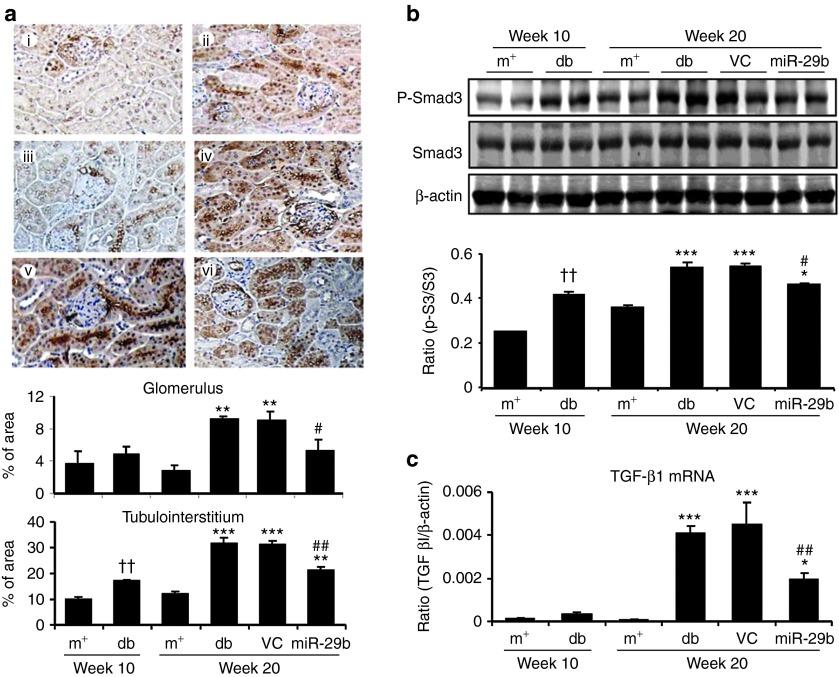
Figure 6.
miR-29b therapy blocks activation of TGF-β/Smad3 signaling in the diabetic kidney of db/db mice. (a) Immunohistochemistry for TGF-β1 expression. (b) Western blot analysis for phosphorylation of Smad3. (c) Real-time PCR for TGF-β1 mRNA expression. (i) week 10 db/m mice, (ii) week 10 db/db mice, (iii) week 20 db/m mice, (iv) week 20 db/db mice, (v) week 20 db/db mice treated with empty vector (VC), and (vi) week 20 db/db mice treated with miR-29b. Data represent the mean ± SE for at groups of 8 mice. *P < 0.05, **P < 0.01, ***P < 0.001 compared to week 20 db/m mice. #P < 0.05, ##P < 0.01 compared to week 20 db/db mice. ††P < 0.01 compared to week 10 db/m. m+, db/m; db, db/db, VC, db/db mice received empty vector control treatment; miR-29, db/db mice received miR-29b treatment. Magnification ×100.

