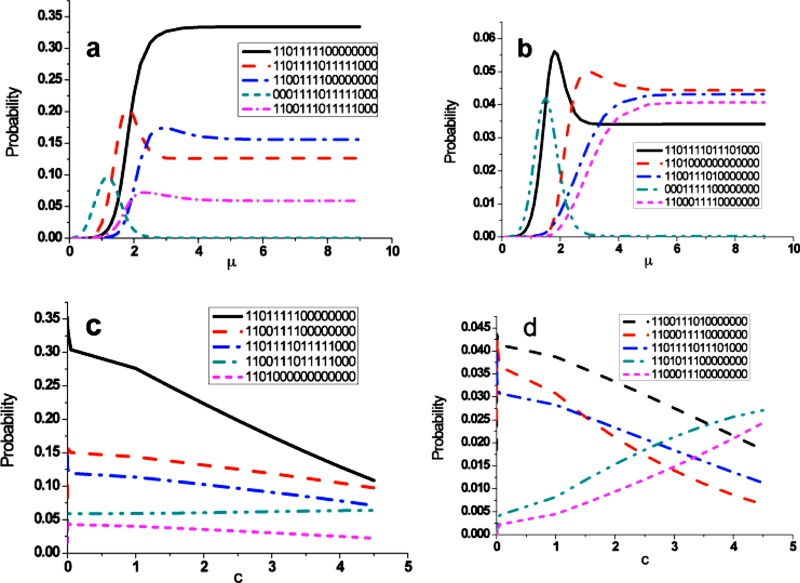
Figure 3.
The most likely probability states demonstrate their characteristics under the exogenous conditions c and μ. In (a) and (b) μ peaks the probability curve at an intermediary value, then decays into the stable states. The μ accumulation and saturation affect the parameter dependent behavior of the cell signaling greatly. (c) and (d) show the parameter c dependent. Unlike dependence on μ, the probabilities monotonously decrease or increase a bit.

