Figure 1.

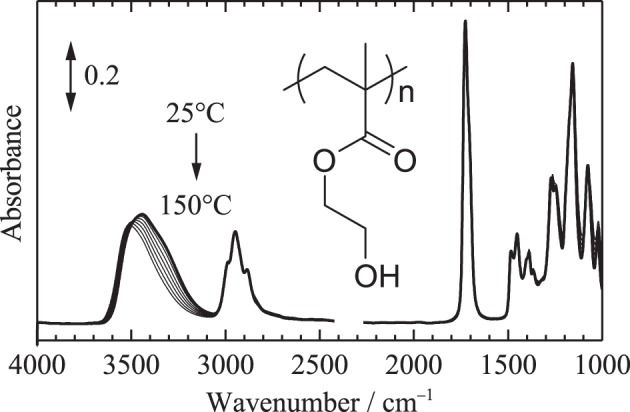
Temperature-dependent IR spectra of PHEMA in the range of 25–150°C measured with an increment of 1°C (all the spectra are not shown here). Bold line corresponds to the spectrum at 25°C.

Temperature-dependent IR spectra of PHEMA in the range of 25–150°C measured with an increment of 1°C (all the spectra are not shown here). Bold line corresponds to the spectrum at 25°C.