
Figure 1.
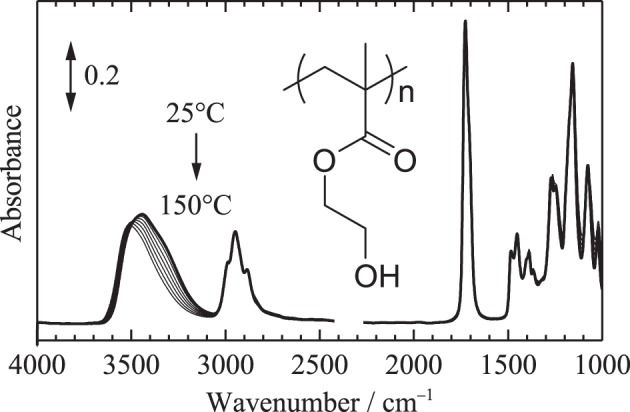
Temperature-dependent IR spectra of PHEMA in the range of 25–150°C measured with an increment of 1°C (all the spectra are not shown here). Bold line corresponds to the spectrum at 25°C.
Official websites use .gov
A
.gov website belongs to an official
government organization in the United States.
Secure .gov websites use HTTPS
A lock (
) or https:// means you've safely
connected to the .gov website. Share sensitive
information only on official, secure websites.
Temperature-dependent IR spectra of PHEMA in the range of 25–150°C measured with an increment of 1°C (all the spectra are not shown here). Bold line corresponds to the spectrum at 25°C.