Figure 3.

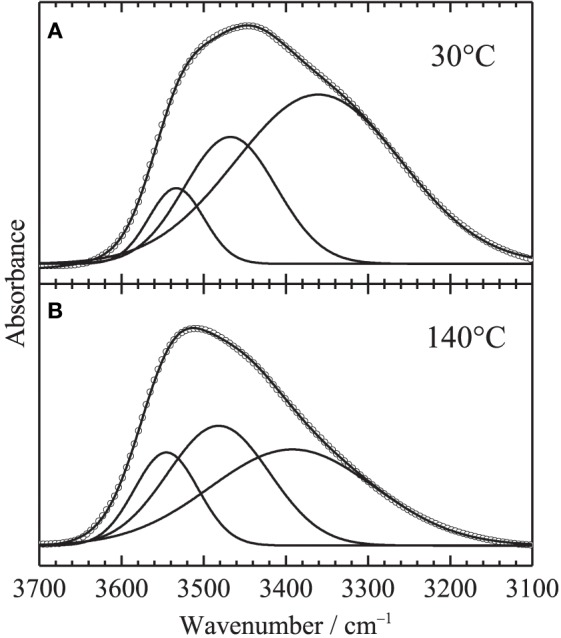
Typical results of the curve fitting in the O-H stretching region assuming three Gaussian components at (A) 30°C and (B) 140°C. Circles and lines in the figure correspond to observed data and fitted lies with the three components.

Typical results of the curve fitting in the O-H stretching region assuming three Gaussian components at (A) 30°C and (B) 140°C. Circles and lines in the figure correspond to observed data and fitted lies with the three components.