
Figure 5.
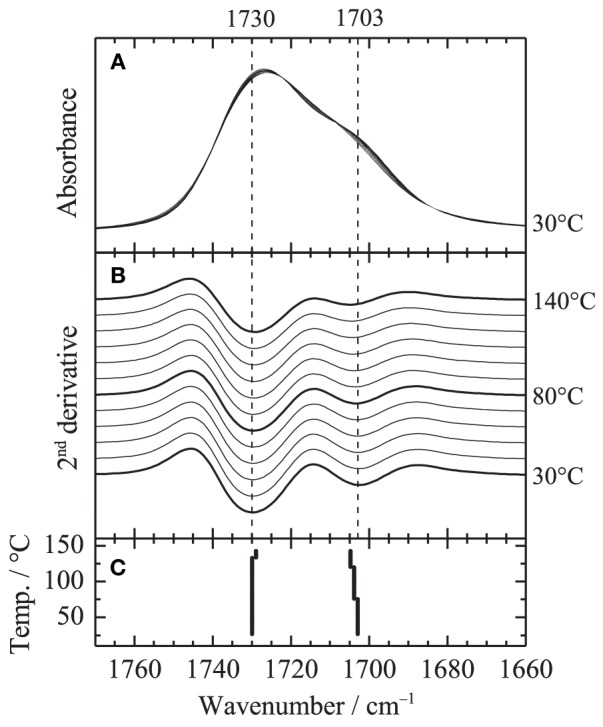
(A) Close up of Figure 1 in the C=O stretching region, (B) second derivative spectra and (C) peak position of the second derivative spectra.
Official websites use .gov
A
.gov website belongs to an official
government organization in the United States.
Secure .gov websites use HTTPS
A lock (
) or https:// means you've safely
connected to the .gov website. Share sensitive
information only on official, secure websites.
(A) Close up of Figure 1 in the C=O stretching region, (B) second derivative spectra and (C) peak position of the second derivative spectra.