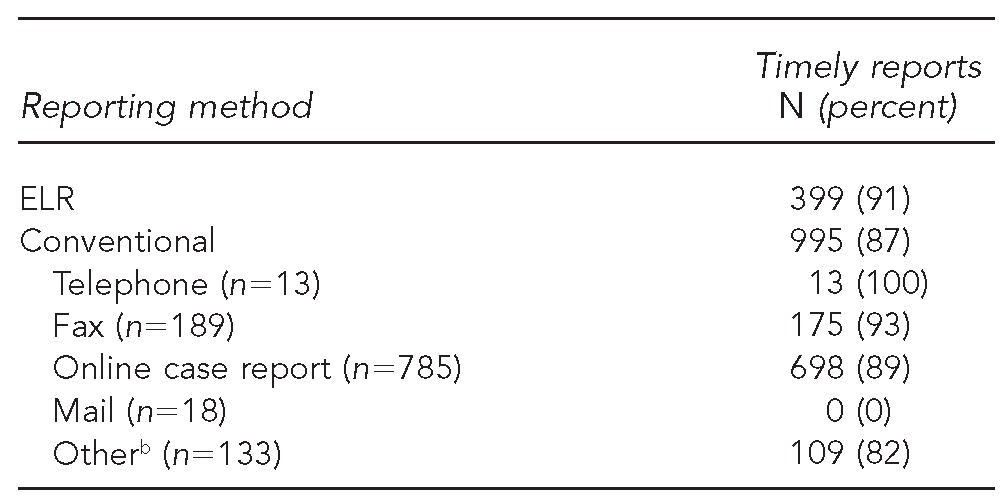
Table 3.
ELR (n=440) and conventional (n=1,138) reports that were reported in ≤1 business day for comparing completeness and timeliness of electronic vs. conventional laboratory reporting—Oklahoma, 2011a

Includes only reports with date of final result listed
bIncludes reports from audits and from the Oklahoma State Public Health Laboratory
ELR = electronic laboratory reporting
