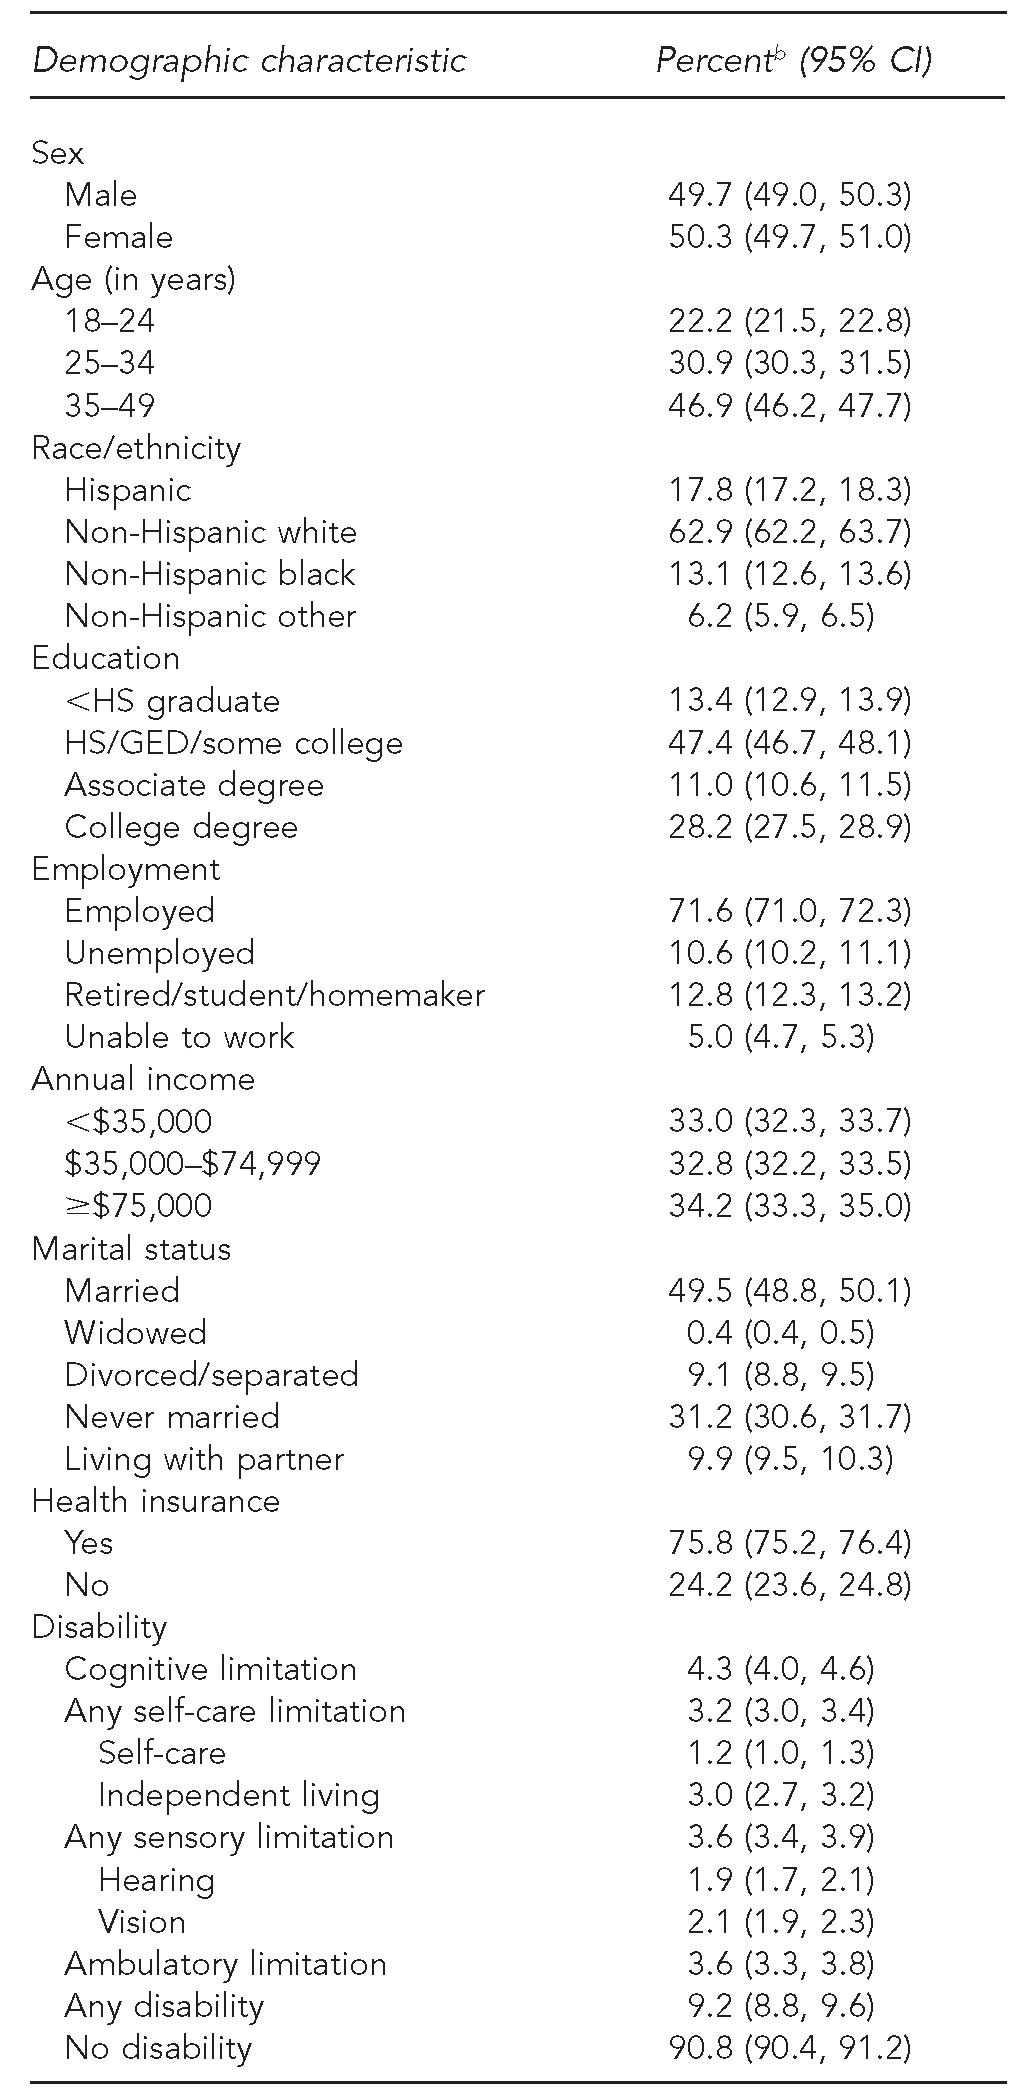
Table 1.
Age-adjusteda prevalence of demographic characteristics of adults 18–49 years of age: 2009–2011 National Health Interview Survey

Age-adjusted to the 2000 U.S. standard population
bPercentages are weighted and may not total 100% in each category due to rounding.
CI = confidence interval
HS = high school
GED = general educational development
