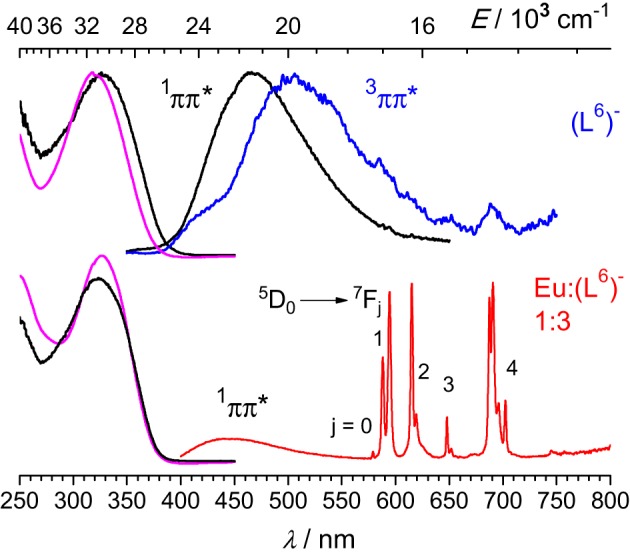
Figure 5.

Left: Normalized absorption and excitation spectra of the free ligand (top) and the 1:3 solution containing EuIII (bottom). Right: Corresponding emission spectra upon excitation at 319 nm (top) or 326.5 nm (bottom). Spectra are for solutions in Tris-HCl 0.1 M (pH 7.4) at 295 K, except for the phosphorescence spectrum of (L6)− measured at 77 K with a 50-μs gate time.
