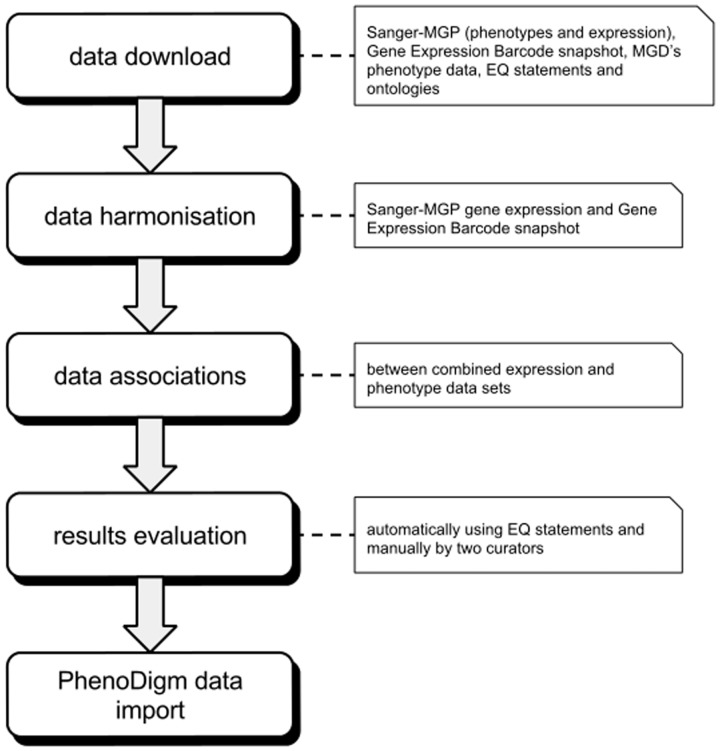
Figure 1.
Illustration of the overall work flow of the study. After downloading and formatting all required data, the expression profiles are merged into one data set. The merged data set is then used to calculate the associations between tissues and phenotypes that are then evaluated. After evaluation, the significant associations are loaded into and provided via the PhenoDigm web interface.

