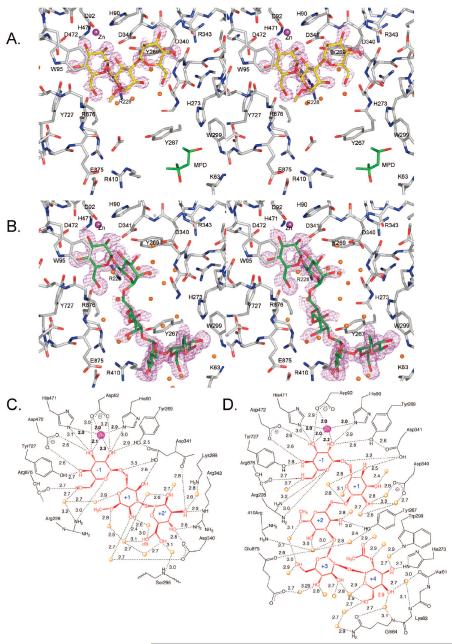
Figure 3.
Binding of 2 and 4 to D204A: stereoviews (divergent) of (A) 2 bound in Fo – Fc omit map contoured at 4σ (0.38 e/Å3) or (B) 4 contoured at 1.6σ (0.15 e/Å3) to visualize density in the +1 and +2 positions. The MPD displaced by GlcNAc binding is shown in panel A. The orientation in both panels is the same to illustrate the differences in position of each compound. (C, D) Interactions less than 3.2 Å are shown for (C) 2 or (D) 3. Distances are given in angstroms. Interacting waters are shown as orange spheres. Zinc is represented as a magenta sphere.

