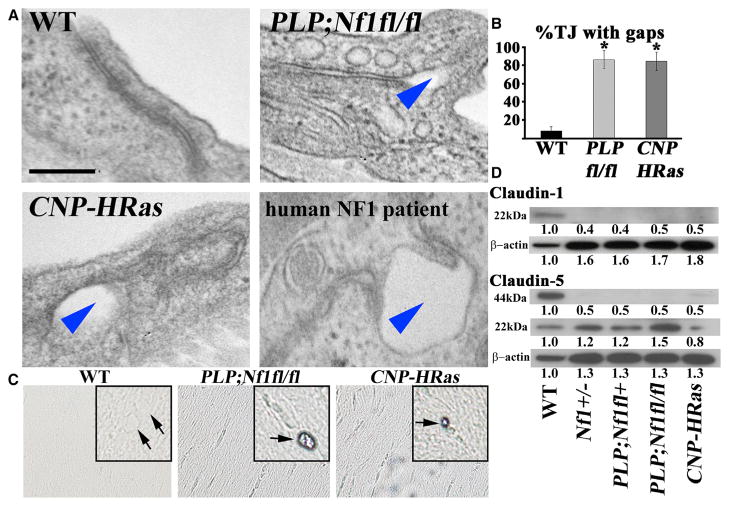
Figure 3. Nf1 Loss or HRas Activation in the Optic Nerve Causes Changes in Claudins and BBB Permeability.
(A) Electron micrographs of optic-nerve cross-sections of capillaries 1 mm from the chiasm (50,000×; scale bar, 200nm) show electron-dense TJs between endothelial cells. Blue arrowheads: areas of TJ disruption.
(B) Quantification of the total TJs with gaps, with 200–300 TJs counted per genotype.
(C) Evans blue stain of longitudinal sections of PLPCre; Nf1fl/fl and CNP-HRas optic nerve. Insets: cross-sections; arrows: blood vessel.
(D) Western blots from total optic-nerve lysates showing claudin-1 and claudin-5. All experiments included three to five animals per genotype. *p < 0.001.
See also Figure S5.

