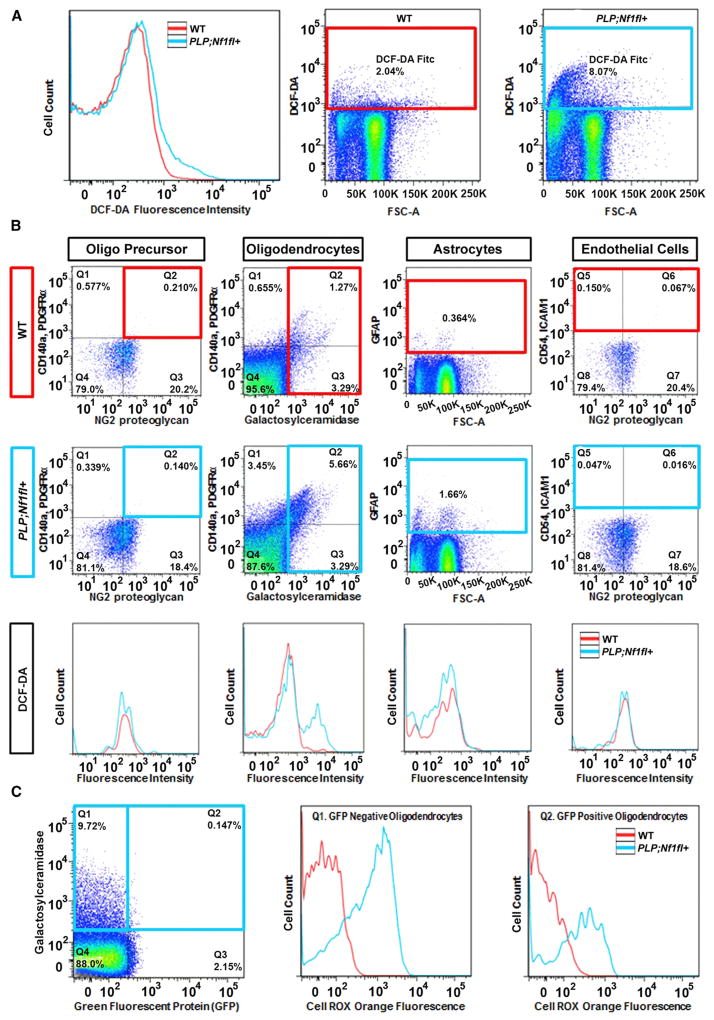
Figure 6. Increased Reactive Oxygen Is Detected Only in Oligodendrocytes.
(A) DCF-DA fluorescence intensity measured by flow cytometry in dissociated forebrain + optic nerves of WT and PLP;Nf1fl+ mice 6 months after tamoxifen injection. Gates for DCF-DA with cell percentages indicated.
(B) Gates were used to discriminate cell types. Top row: WT animals are shown with red gates. Middle row: PLP;Nf1fl+ animals are shown with blue gates. Bottom row: DCF-DA fluorescence intensities per cell type with WT (red) and PLP;Nf1fl+ (blue) lines.
(C) Cell Rox Orange fluorescence in GFP− and GFP+ cells.

