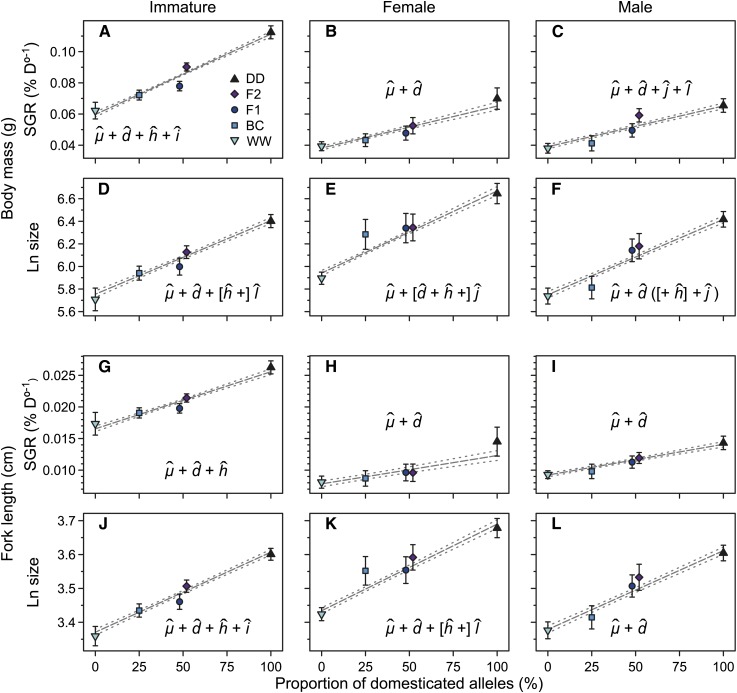
Figure 6.
Cross means for specific growth rate (SGR) and size at age for the three maturity groups. Marginal predictions from maturity-specific models for means of SGRs (A, B, C, G, H, I) and sizes (D, E, F, J, K, L) are shown for body mass (A–F) and fork length (G–L). Means of crosses are differentiated by colors and symbols as indicated in the key of A. Error bars represent ∼95% confidence intervals. Cross means for F1 and F2 hybrids have been offset to improve depiction. All cross abbreviations are as in Figure 1. For each trait, the estimated outbreeding effects, abbreviated as in the text, are indicated. Effects in brackets were nonsignificant and have been removed from the final models. The model for F differed between WLS and LMM approaches and terms in parentheses were assessed only under the WLS approach. The grey lines with dashed 95% confidence intervals represent predicted cross positions under an additive outbreeding effect model.

